Figure 4.
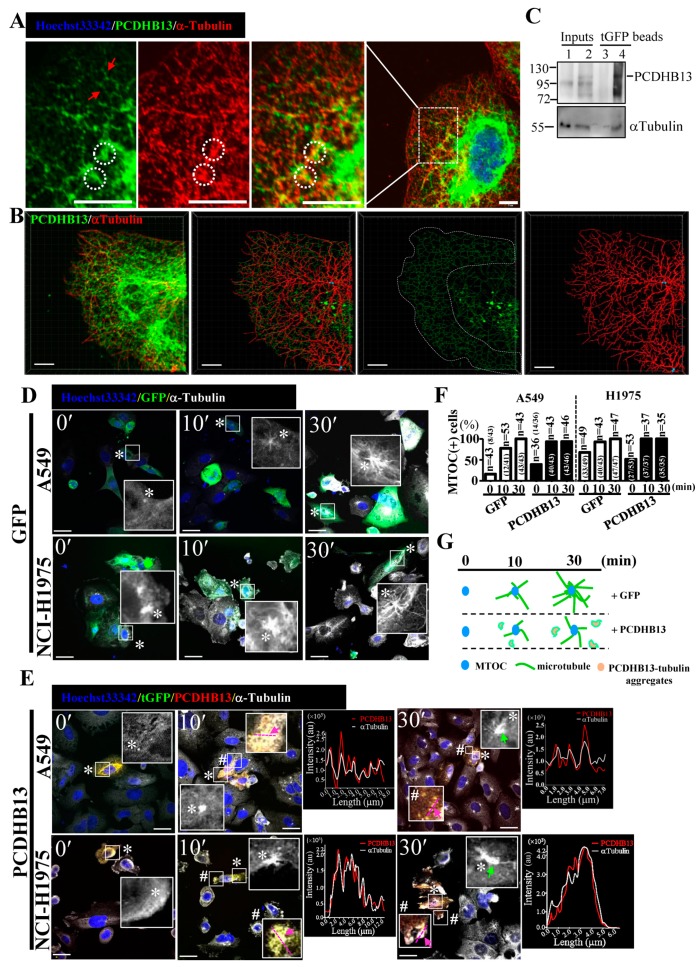
PCDHB13 disrupts microtubule dynamics in NSCLC cells. (A) Cellular localization of PCDHB13 in A549 cells. Cells were stained with PCDHB13 (green) and α-Tubulin (red). Hoechst33342 was used to stain nuclei (blue). Boxed regions are magnified in the panels to the right. Red arrows indicate the filamentary structure of PCDHB13. White circles indicate the cellular aggregates formed by PCDHB13 and α-Tubulin. Bar: 20 μm. (B) PCDHB13 and α-Tubulin are shown in red and green, respectively. Cytoskeletal projections of each protein were simulated by Imaris software. Yellow color indicates colocalization of PCDHB13 and α-Tubulin. Bar: 8 μm. (C) A549 cell lysates without (lane 1 and 3) or with tGFP-tagged PCDHB13 overexpression (lane 2 and 4) were harvested for co-immunoprecipitation (Co-IP) assay using the anti-tGFP conjugated magnetic beads. IP eluates were analyzed by Western blot for PCDHB13 and α-Tubulin. (D,E) GFP (D) or PCDHB13-tGFP vector (E) transfected A549 and H1975 cells pretreated with 20 μM nocodazole were stained for PCDHB13 (red) and α-Tubulin (white) at 0, 10, and 30 min after nocodazole washout. Higher magnifications of the areas in the white boxes marked by * or # are shown in the corresponding panel. Hoechst33342 was stained for nuclei (blue). Green arrows indicate MTOC with defective microtubule outgrowth. The spatial correlation of PCDHB13 with microtubules in the indicated region (pink lines mark two opposite ends, indicated by pink arrows) is shown by a line-series analysis. The red and white lines in the right panels represent the PCDHB13 and α-Tubulin fluorescence intensities, respectively. au: arbitrary units. Bar: 20 μm. (F) Quantification of MTOC formation in cells transfected by GFP or PCDHB13 after nocodazole washout. g Illustration of the phenomena shown in (D,E).

