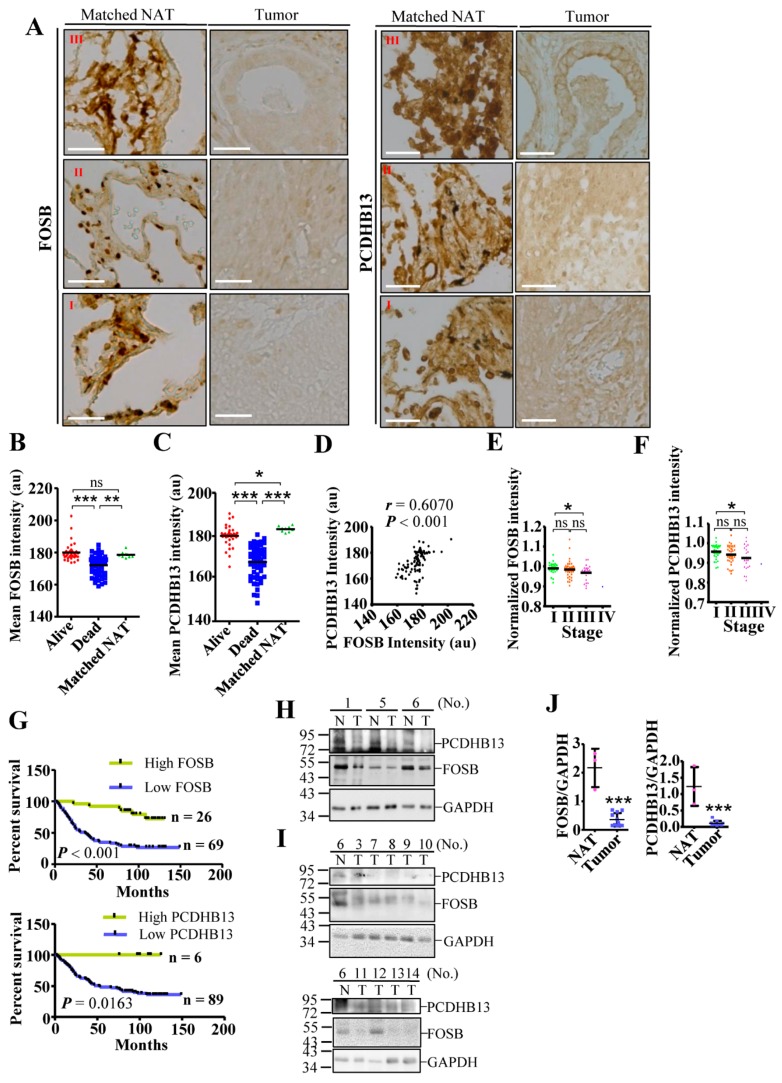
Figure 7.
Downregulation of FOSB and PCDHB13 in lung cancer patients. (A) Matched NAT (n = 9) and lung cancer samples (n = 31, 42, 21, and 1 for grade I, II, III, and IV samples, respectively) were stained with DAB signal enhancement for FOSB and PCDHB13. Scale bar: 50 μm. (B,C) Quantification of DAB staining intensity for FOSB (B) and PCDHB13 (C) in alive, dead, and matched NAT samples. (D) Correlation between FOSB and PCDHB13 levels in the alive group (p < 0.001, Spearman’s r = 0.6070). (E,F) DAB staining intensity of FOSB (E) and PCDHB13 (F) were normalized to the respective values from matched NAT and were classified according to the disease stage. (G) Survival analysis of lung cancer patients according to relative FOSB expression (upper panel) and PCDHB13 expression (lower panel) level. Statistical comparisons of survival curves between groups were performed by Log-rank test. ** p < 0.001 for FOSB expression and *p < 0.05 for PCDHB13 expression. (H,I) Tissue extracts from twelve NSCLC patients were analyzed by Western blot using antibodies against FOSB, PCDHB13, and GAPDH. P: Lysates from EGFP/PCDHB13/FOSB-transfected A549 cells. N: normal adjacent tissue; T: tumor. (J) Quantitation of the FOSB and PCDHB13 levels shown in (H) and (I) (n = 11). Quantitative results represent the mean ± SD (two-tailed t-test: ns, not significant; * p < 0.05; ** p < 0.01; *** p < 0.001).

