
FIG. 2.
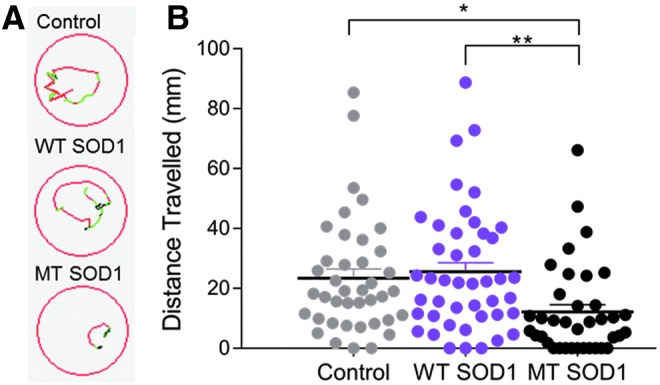
(A) Representative images displaying the trajectory of movement of individual larvae during a photomotor response test within a 96 multiwell plate (red lines indicate fast movement, green lines indicate slow movement, and black lines indicate inactivity). (B) Larvae injected with MT SOD1 traveled a significantly shorter distance during the photomotor response test compared with noninjected controls (*p = 0.023) and those that expressed WT SOD1 (**p = 0.004). There was no statistically significant difference in the distance traveled by WT SOD1 and control larvae. Each dot represents an individual larva; noninjected: n = 40; WT SOD1: n = 44; MT SOD1: n = 37.