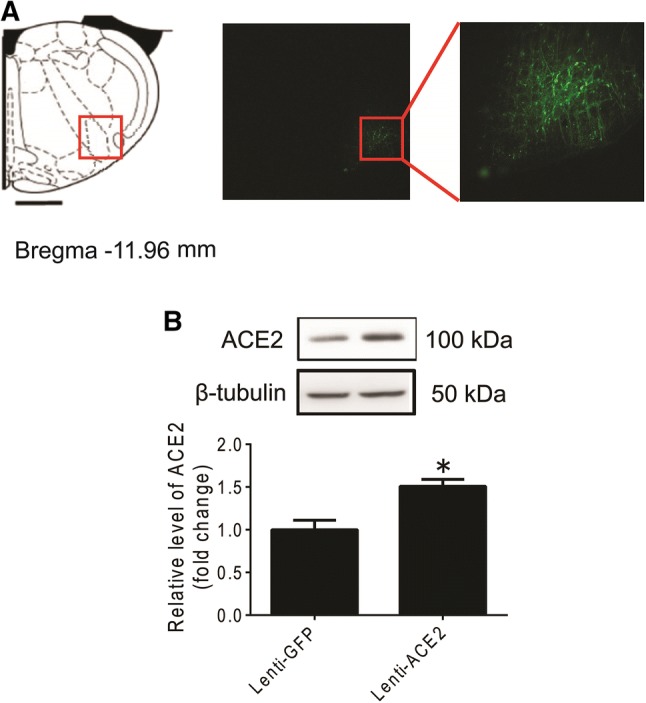
Fig. 3.

Efficiency of ACE2 overexpression in the RVLM. (A) According to the rat atlas (left), green fluorescent protein (GFP) was expressed in the RVLM (right). (B) Bar graphs show the protein levels of ACE2 in the RVLM in SHRs after injection of Lenti-ACE2 into the RVLM. Values are mean ± SEM, n = 5/group, *P < 0.05 vs Lenti-GFP.
