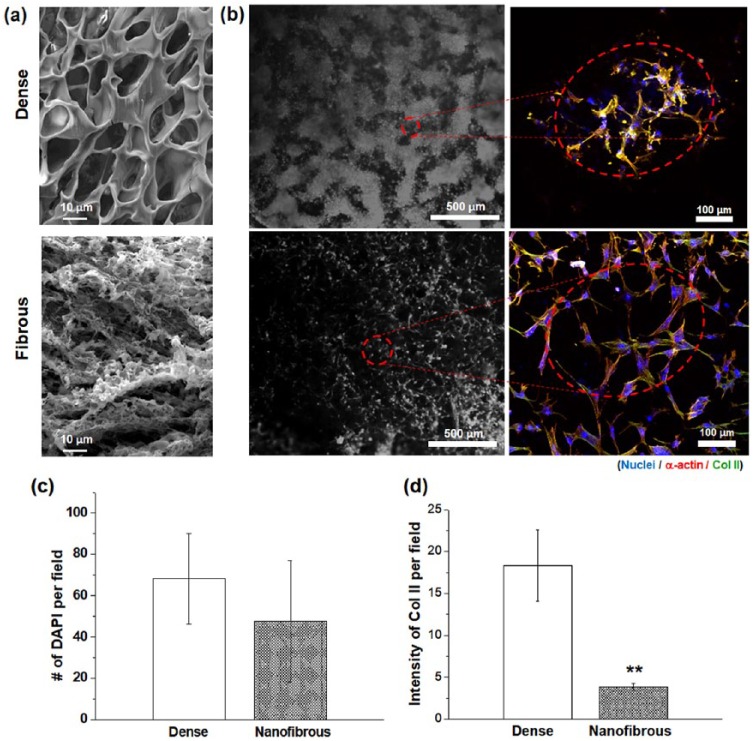
Figure 3.
Cell-to-cell interaction assays compared between dense- and nanofibrous-surfaced scaffolds: (a) SEM morphological difference of dense- or nanofibrous-surfaced matrices used for the test; (b) representative CLSM images of immuno-stained cells at day 7 (blue: nuclei, red: α-actins, and green: Col II); (c) DAPI-stained nuclei number; and (d) Col II expression intensity, assayed from CLSM images.
Statistically significant difference noted (**p < 0.01; n = 3).

