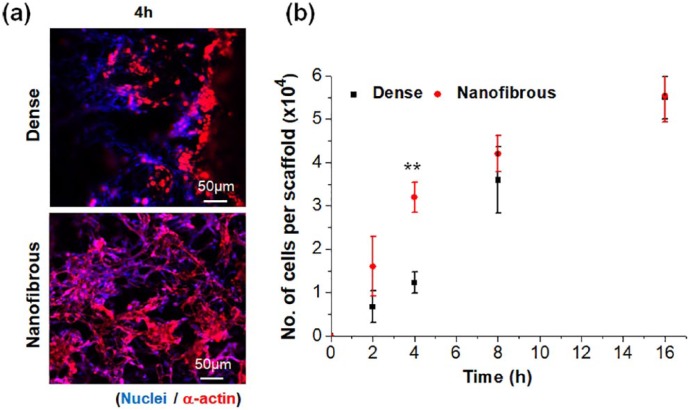
Figure 5.
MSCs adhesion to dense- or nanofibrous-surfaced 3D scaffolds: (a) representative CLSM images of immuno-stained cells at 4 h (blue: nuclei, red: α-actins) and (b) cell adhesion number measured at various initial time points. Negative controls not shown.
Statistically significant difference noted (*p < 0.05; **p < 0.01; n = 3).

