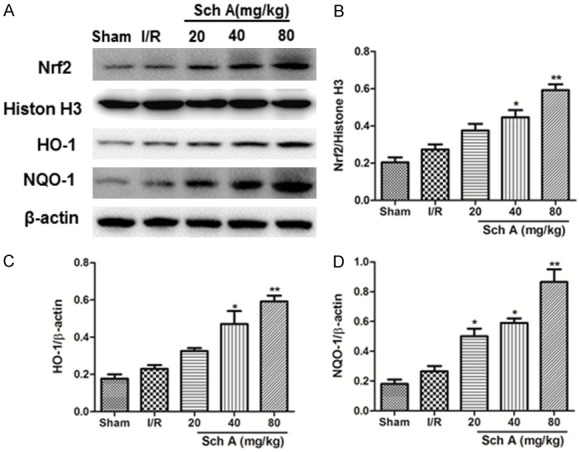
Figure 4.

Sch A induces Nrf2 activation in tissues. Protein expression of Nrf2, HO-1, and NQO-1 (A) was evaluated by Western blotting analyses. (B-D) Quantification of Nrf2, HO-1, and NQO-1 levels normalized to that of β-actin. All data are mean ± SD. (##P < 0.01 vs. Sham group; *P < 0.05, **P < 0.01 vs. I/R group).
