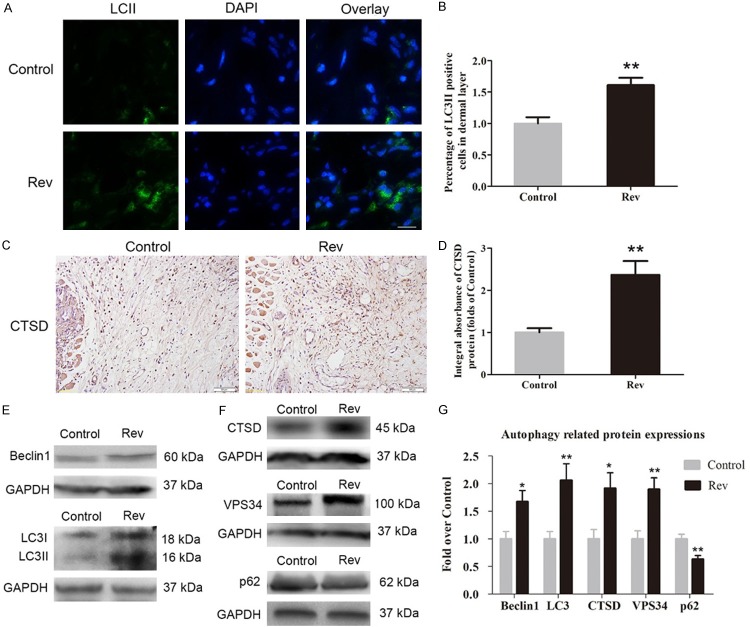
Figure 5.
Resveratrol upregulated the level of autophagy in ischemic area of the flaps. On day 7, the level of autophagy in area II of flap was assessed by immunofluorescence for LC3II, IHC for CTSD, Western blotting for Beclin1, LC3II/I, CTSD, VPS34 and p62. A. Immunofluorescence for LC3II punctate dots in random skin flaps of the Control group and Rev group. Autophagosomes were labeled with LC3II (green), nuclei were labeled with DAPI (blue) (scale bar, 15 μm). B. LC3II-positive cell densities were quantified and analyzed in ischemic area in each group. C. IHC for CTSD expression in area II of flap in the Control group and Rev group (original magnification, × 200; scan bar, 50 μm). D. Optical density values of CTSD expression were quantified and analyzed in each group. E, F. Western blotting was performed for Beclin1, LC3II/I CTSD, VPS34 and p62 in the Area II tissue in the Control and Rev groups. The gels were run under the same experimental conditions, and cropped blots are used here. The Original images are available in Figure S1D. G. Optical density values of the expression of Beclin1, LC3II, CTSD, vps34 and p62 were quantified and analyzed in each group. Significance: *P < 0.05 and **P < 0.01 vs. the Control group. Data were expressed as means ± SEM, n = 6 per group.

