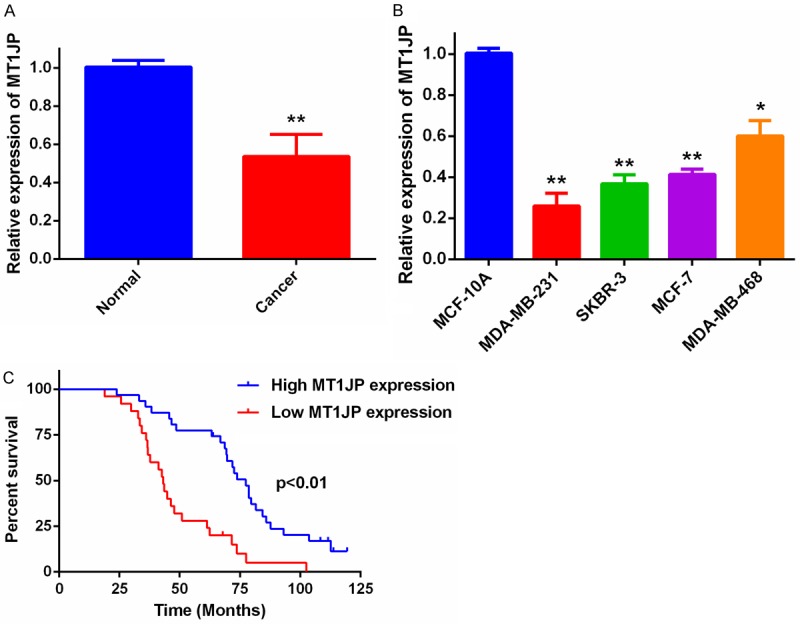
Figure 1.

Relative MT1JP expression levels in breast cancer and the clinical significance. A. Relative MT1JP expression in 56 paired samples of breast cancer tissue and adjacent non-tumor tissues by qRT-PCR analysis. **P < 0.01. B. MT1JP levels in breast cancer cells compared with levels in normal MCF-10A breast epithelial cells. *P < 0.05, **P < 0.01. C. Kaplan-Meier survival curves for patients with breast cancer tissues expressing low and high levels of MT1JP.
