
Figure 6.
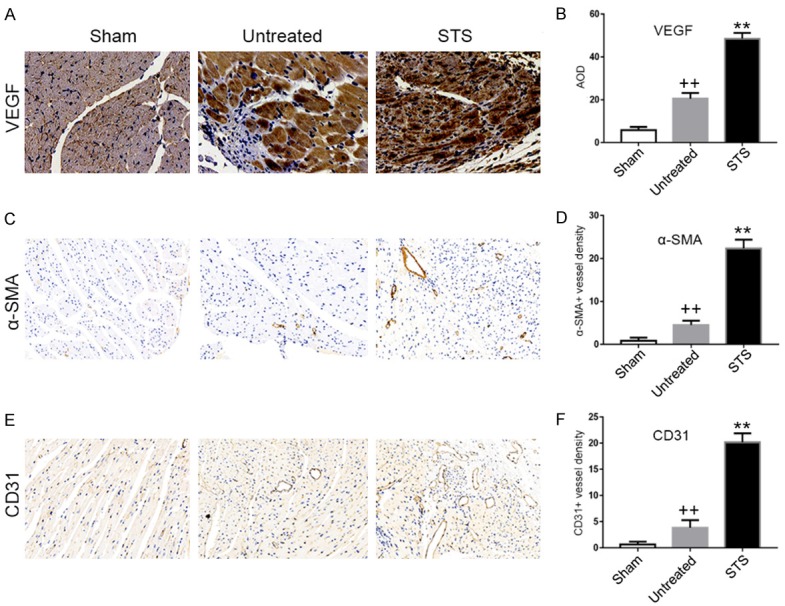
STS promoted angiogenesis in MI mice. Immunohistochemical staining for VEGF (A), CD31 (C) and α-SMA (E) in the sham, untreated and STS groups. (B) Quantitative analysis of VEGF expression by AOD in each group. Quantification of α-SMA-positive vessels (D) and CD31-positive vessels (F) in a 200× high-power field in each group. **P<0.01 compared to the untreated group, ++P<0.01 compared to the sham group.