
Figure 1.
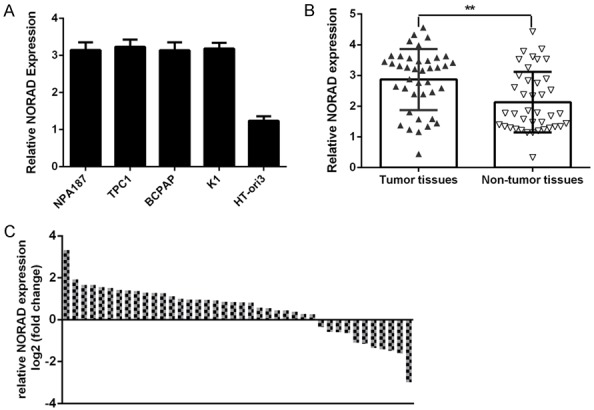
NORAD was increased in PTC cell lines and samples. A. The expression of the lncRNA NORAD in four PTC cell lines (NPA187, TPC1, BCPAP and K1) and in a normal thyroid cell line (HT-ori3) was determined by qRT-PCR analysis. B. The expression of the lncRNA NORAD in PTC tissues was measured by qRT-PCR. C. Of 40 PTC samples, 29 (72.5%) showed upregulation of NORAD expression compared to adjacent tissues. Data are presented as the log2 fold change in PTC tissues relative to nontumor tissues. **P < 0.01.