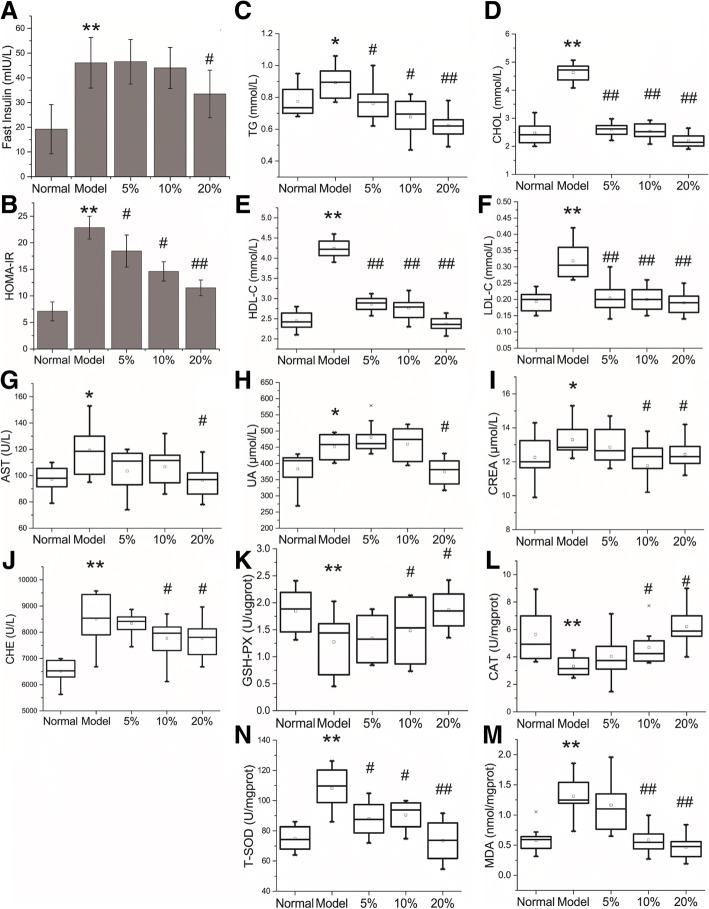
Fig. 2.
a, the fast insulin level of mice after the diabetes mice were treated five weeks; b, the index of Homeostatic Model Assessment of Insulin Resistance (HOMA-IR), HOMA-IR = Glucose (mmol/L)╳Insulin (mU/L)/22.5; C-N, boxplots for values of TG (c), CHOL (d), HDL-C (e), LDL-C (f), AST (g), UA (H), CREA (i), CHE (j), GSH-PX (k), CAT (l), T-SOD (m), MDA (n). *p < 0.05 and ** p < 0.01 model group vs. normal group, # p < 0.05 and ## p < 0.01 MBBP treatment group vs. model group

