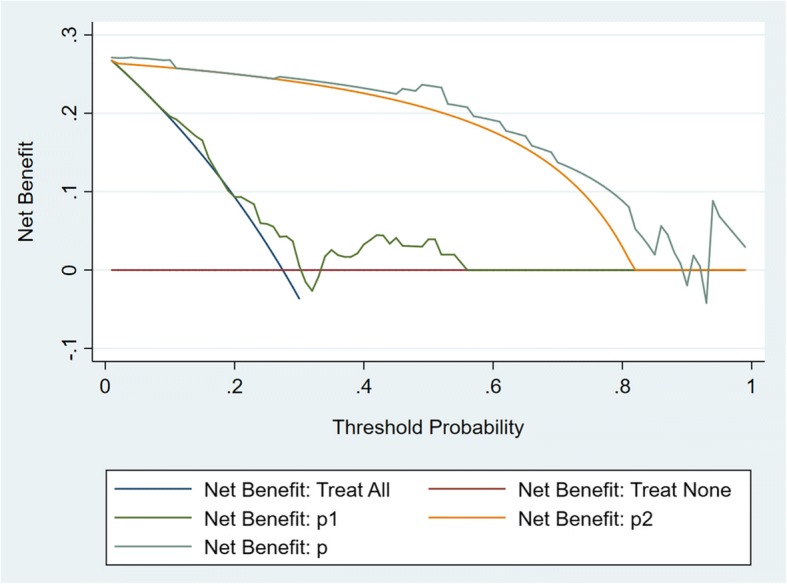
Fig. 4.

Decision curves to assign patients as positive or negative for ACC in the palate. The curve which maximized net benefit represented the optimal strategy for the associated threshold probability. The red line indicated a policy of treating no one, the blue line indicated a policy of treating all. P1 = the probability predicted by the model with factor of age alone. P2 = the probability predicted by the model with factor of greater palatine foramen enlargement alone. P = the probability predicted by the model with two factors of age and greater palatine foramen enlargement. ACC = adenoid cystic carcinoma
