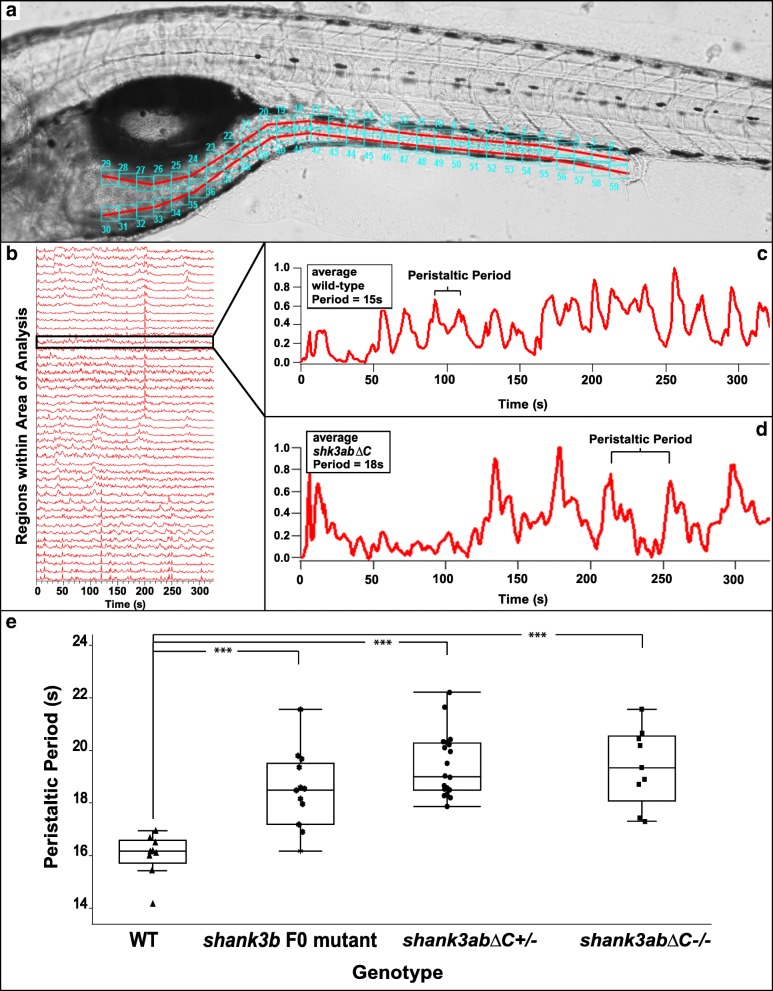
Fig. 3.
shank3abΔC−/− and shank3abΔC+/− larvae have reduced peristaltic frequencies and DT motility compared to WT. a Representative image of a zebrafish embedded for analysis, with the area of analysis (AOA) denoted by the red lines and the regions of evaluation denoted by the cyan boxes (1–60). The AOA was manually drawn in, and the program automatically fills a set number of recording regions along the AOA. For our work, this number was set at 30 dorsal and 30 ventral, but the number and size of the boxes can be adjusted if necessary. b Representative WT data output, showing output from all regions of evaluation within the AOA; as the peristaltic contraction moves down the DT tract, the Igor Pro program registers the change in pixel intensity. c Representative image of an individual analysis readout for a WT larva, with the change in pixel intensity (y-axis) measured as time progresses (x-axis). Igor Pro can separate individual regions of evaluation within the AOA and give data on peristaltic periodicity in a specific region, allowing users to get overall averages throughout multiple regions within the AOA. d Representative image of an individual analysis readout for a shank3abΔC +/− larvae, note the larger space between peaks, indicating reduced peristaltic frequencies. e WT larvae are shown to have peristaltic rates significantly (p < 0.0001) more frequent than that of shank3abΔC mutants. F0 shank3b larvae are significantly slower than WT, while F0, shank3abΔC +/− and ΔC −/− show no significant difference between each other. Each point represents an average frequency from a 7-day-old larva

