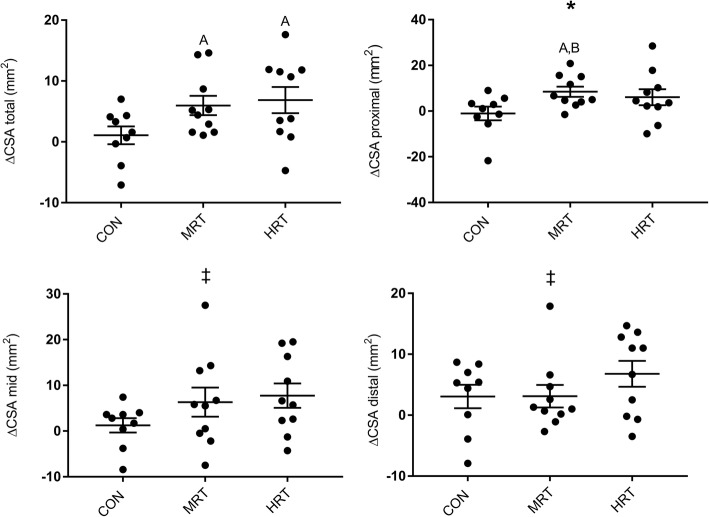
Fig. 5.
Changes in patellar tendon cross-sectional area (CSA) in three different regions (proximal, mid, distal) and in total after 12 months heavy resistance training (HRT), moderate load resistance training (MRT) or no training (CON). Bars represent mean ± SE. *Significant time x group interaction based on repeated measures ANOVA (pz0.05). ‡: Main effect of time (p < 0.05). a: Significant change from 0 to 12 months (p < 0.05), b: Significantly different from CON (p < 0.05), c: Significantly different from MRT (p < 0.05) based on Tukey-Kramer post-hoc test

