
Fig. 7.
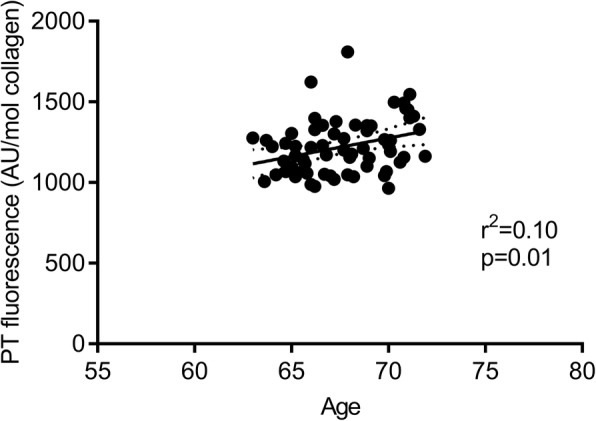
Correlation between age and patellar tendon (PT) fluorescence using bot PRE and POST values as determined by Pearson’s correlation coefficient. Dotted lines are 95% confidence bands of the best fit
Official websites use .gov
A
.gov website belongs to an official
government organization in the United States.
Secure .gov websites use HTTPS
A lock (
) or https:// means you've safely
connected to the .gov website. Share sensitive
information only on official, secure websites.
Correlation between age and patellar tendon (PT) fluorescence using bot PRE and POST values as determined by Pearson’s correlation coefficient. Dotted lines are 95% confidence bands of the best fit