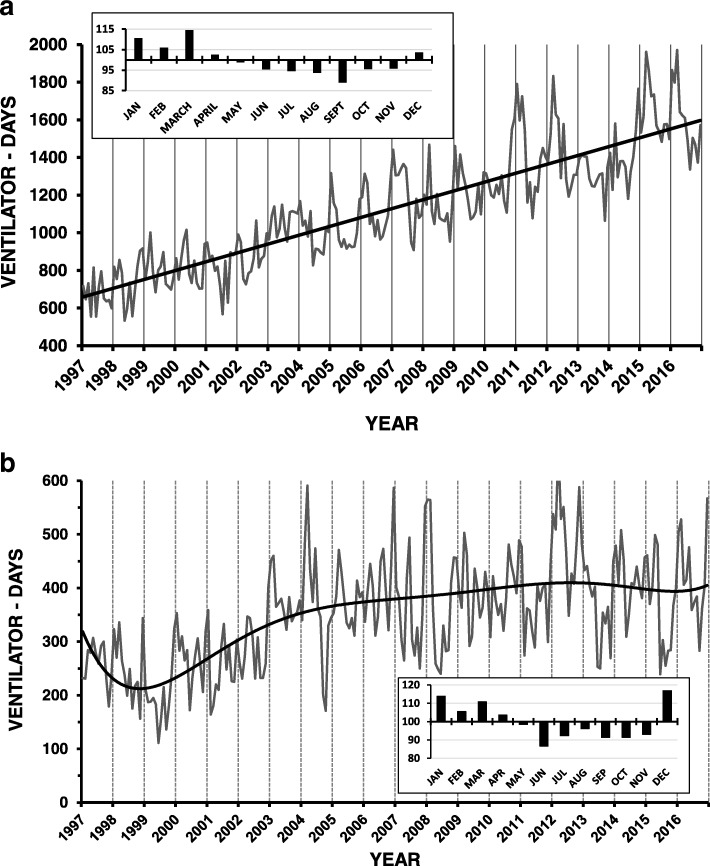
Fig. 2.
a University hospital: There was a linear increase in the number of monthly ventilator days over the twenty-year study period. Vertical gridlines indicate January of each year. The pattern was generally seasonal, especially during the latter half of the period, with peak ventilator use occurring during the winter. This was further demonstrated by the seasonality analysis (insert). b Community hospital: The total monthly ventilator days increased over the first ten-year period but remained static over the subsequent 10 years. Vertical gridlines indicate January of each year. The pattern was often seasonal, with peak ventilator use occurring during the winter as further demonstrated by the seasonality analysis (insert)

