Fig. 8.

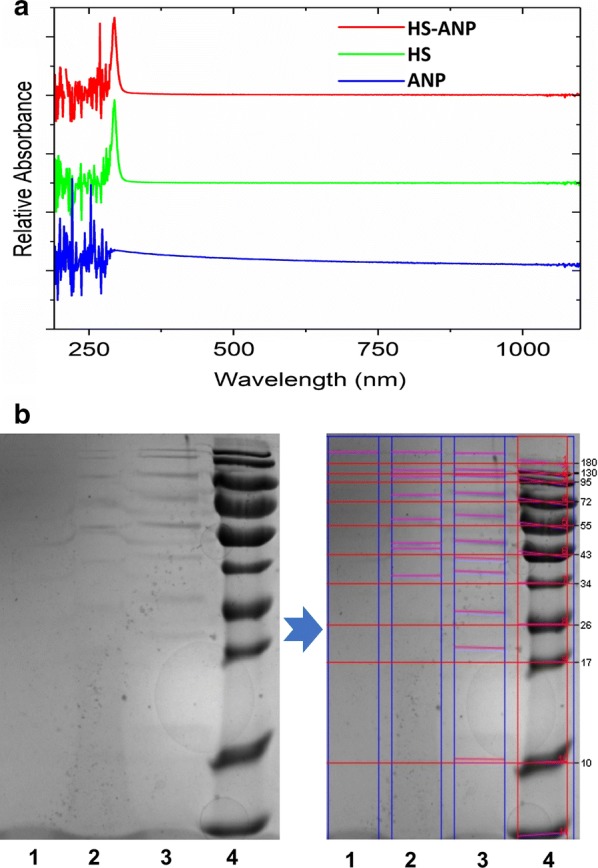
Physicochemical characterization of the biointeraction between ANP and HS. a UV–Vis spectrum of ANP, HS, and ANP–HS. b The SDS-PAGE analysis of ANP, HS, and ANP–HS. (1: ANP, 2: ANP–HS, 3: HS; 4: Ladder). Red lines marked protein bands

Physicochemical characterization of the biointeraction between ANP and HS. a UV–Vis spectrum of ANP, HS, and ANP–HS. b The SDS-PAGE analysis of ANP, HS, and ANP–HS. (1: ANP, 2: ANP–HS, 3: HS; 4: Ladder). Red lines marked protein bands