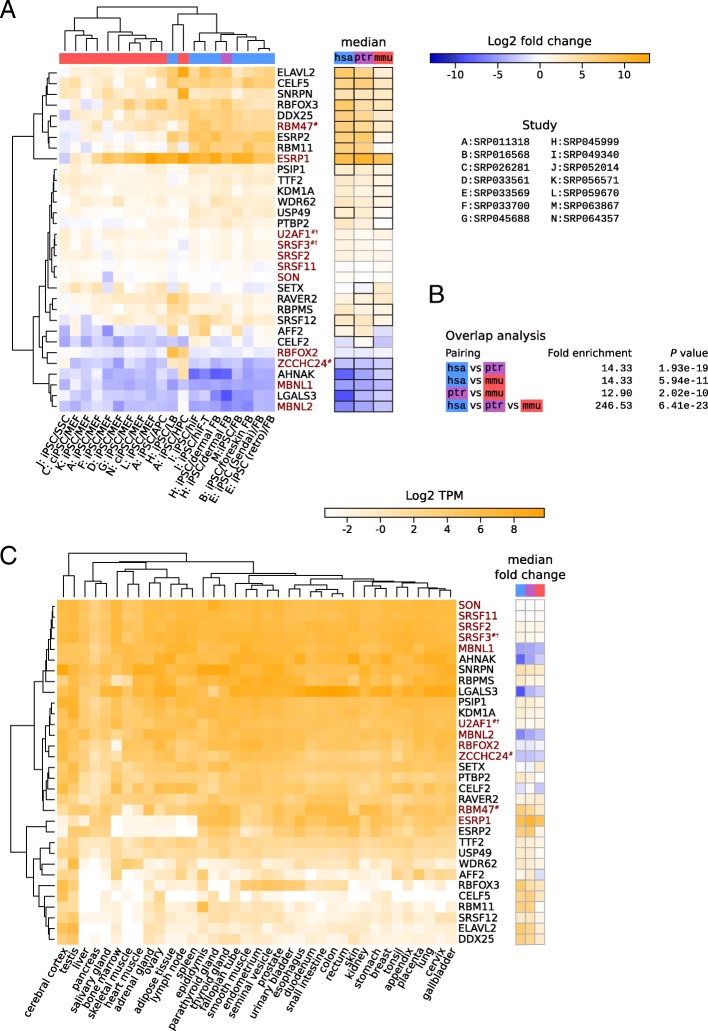
Fig. 2.
Splicing factors with consistent gene expression changes. (a) The left heatmap shows log2 fold-changes in reprogrammed versus parental cells (columns) for genes (rows; human gene symbol) associated with GO term “RNA splicing” (GO:0008380 or descendants). Orange, blue and white indicate higher, lower, or unchanged expression, respectively, in the reprogrammed state. Only genes with (i) a median expression of at least 4 TPM in either endpoint and (ii) a 5-fold difference in expression in at least half of the comparisons of any organism (human, chimpanzee, mouse) are shown. Genes for which one-to-one pairwise orthologous relationships and corresponding gene symbols were unavailable (Ensembl release 84) were disregarded. Putative splicing factors previously implicated in reprogramming (symbols in maroon) [15, 23–27, 66] were included, regardless of them passing the stated criteria. Some of these were not associated with GO:0008380 or descendants(#) and/or required manual curation of orthologous relationships(†). The right heatmap shows an additional summary: the median fold change for each organism (black borders indicate genes that pass the expression and fold change filters in a given organism). Organism color coding, column labels and dendrograms/clustering as in Fig. 1d/e. See Table 1 and Additional file 2 for details on the used data. (b) Evaluation of the significance of overlaps of genes identified in sets of organisms done with the SuperExactTest R package [93]. Fold enrichments and corresponding P values are indicated for all 2-way, as well as for the 3-way comparison. (c) Expression levels of genes in (A) in a panel of human tissues in The Human Protein Atlas (release 16) [31] (log2 TPM) shown along with the median fold-change observed between iPSCs and parental cells in samples from the three organisms (taken from panel A). Dendrograms and clustering as in Fig. 1d/e

