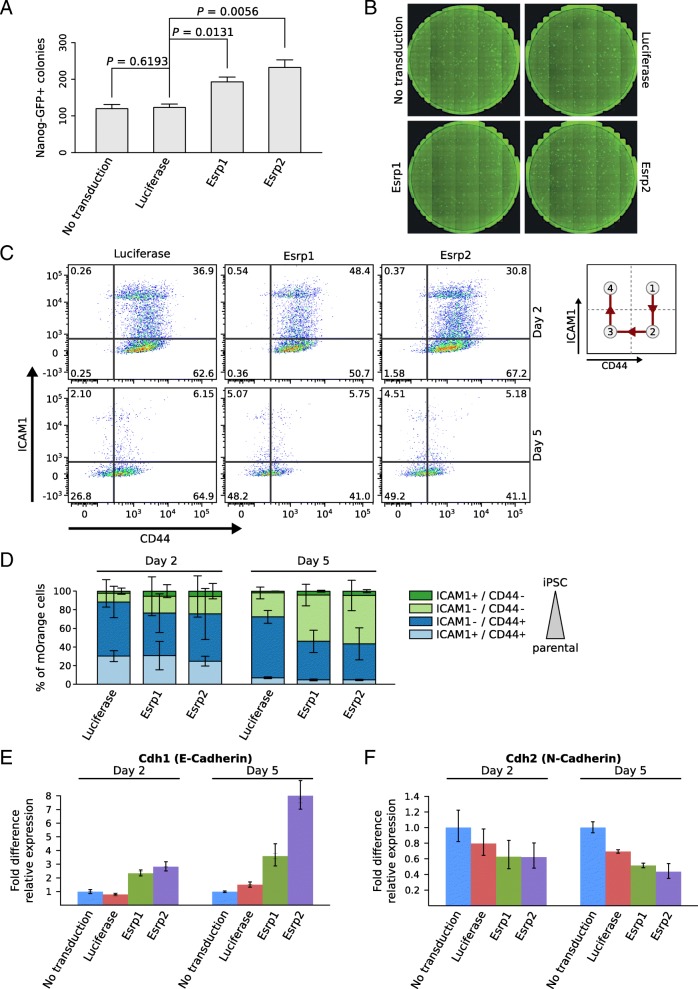
Fig. 3.
ESRPs enhance reprogramming efficiency of TNG-MKOS-MEFs. (a) Number of Nanog-GFP+ colonies counted on day 15 of reprogramming with/without overexpression of either Esrp1, Esrp2 or Renilla luciferase expression controls. Error bars show standard deviations and P values are based on two-tailed paired t-tests (n = 3). See Additional file 16 for raw data. (b) Representative images of one entire culture dish per condition. Images were taken by a Celigo Imaging cytometer. (c) Changes in CD44 and ICAM1 protein levels, measured by flow cytometry during the initial stages of TNG-MKOS-MEF reprogramming (day 2 and day 5). TNG-MKOS-MEFs ectopically expressed either Renilla luciferase (left), Esrp1 (middle) or Esrp2 (right). The gates define cells in different reprogramming stages as previously described [36]. The expected shift of cells along the reprogramming time course is indicated in the schematic diagram on the right. Data from a representative experiment (of n = 3 experiments) are shown. (d) Mean percentages of cells in each gate, with standard deviation computed from the three independent experiments. Gates are labeled ICAM1+ / CD44+, ICAM- / CD44+, ICAM1- / CD44-, ICAM1+ / CD44- and correspond to the ones in (c), clockwise, starting from the top right. An arrow next to the legend indicates the order in which sub-populations appear in a typical reprogramming experiment. See Additional file 16 for raw data. (e and f) qRT-PCR measurements of epithelial and mesenchymal markers Cdh1 (e) and Cdh2 (f) at day 2 and 5 of the reprogramming process. Samples were normalized to non-transduced samples for each day. GAPDH (glyceraldehyde-3-phosphate dehydrogenase) was used as an internal control. Relative fold changes were calculated by the ΔΔCT method [89] . Error bars represent standard deviations (n = 3). See Additional file 16 for raw data

