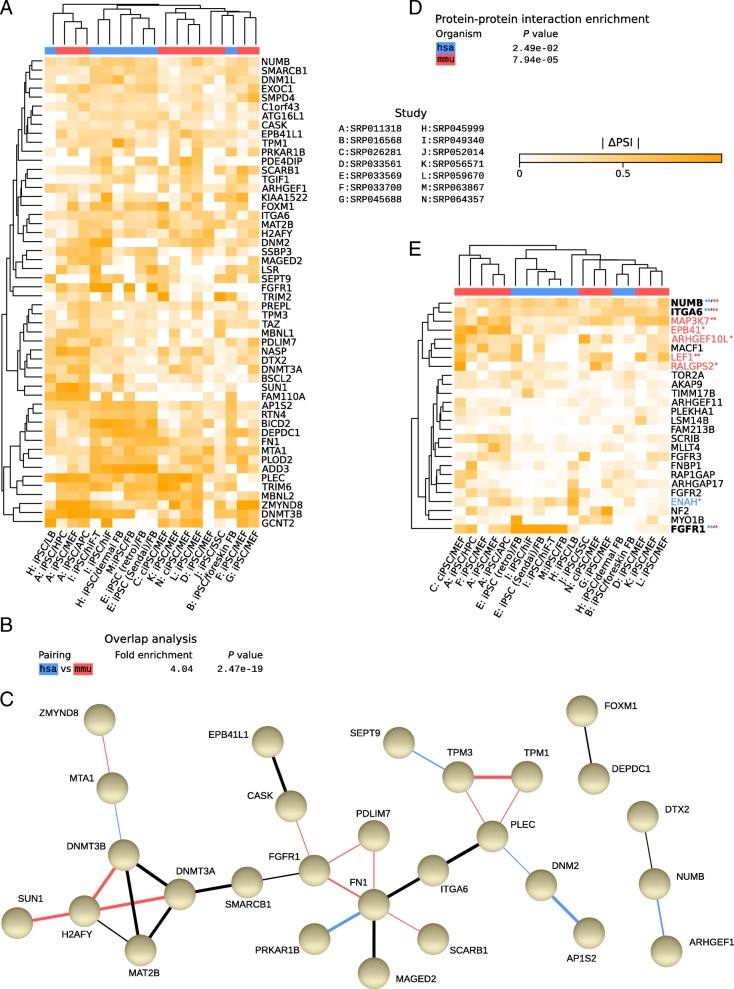
Fig. 5.
Consistent changes in alternative splicing. (a) Heatmap indicating absolute changes in ‘percent spliced in’ (ΔPSI) of splice variants (rows) between reprogrammed and parental cells (columns). Gene symbols (human symbols shown) indicate the genes that harbor any of the 500 most robust AS events, ranked by absolute mean z-scores across comparisons, in both human and mouse, with the shown absolute ΔPSI values corresponding to the most robust event for a particular gene. Only events with a minimum combined expression of ≥2 TPM for all transcripts involved in the event (median expression across all corresponding samples) were considered. Genes for which one-to-one pairwise orthologous relationships and corresponding gene symbols were unavailable in Ensembl release 84 were disregarded. Column labels, dendrograms/clustering and color coding of species as in Fig. 1d/e. (b) Overlap enrichment analysis of genes in (a) computed and represented as in Fig. 2b. (c) Combined interaction network of proteins corresponding to the genes in panel (a), derived from STRING [42]. STRING analyses were carried out individually for human and mouse, and the results were merged based on orthology relationships. The widths of connecting lines indicate STRING confidence levels. Interactions reported for both organisms are shown in black, those annotated for human or mouse only are shown in blue and red, respectively. Proteins with no interacting partners within the set were omitted. (d) STRING protein-protein interaction enrichment P values. (e) As in (a), but only for reported ESRP targets [15, 39] and corresponding AS events. Here, events were not filtered based on expression. Genes with symbols in blue, red or bold harbor the most robustly differentially spliced events (among top 100 or 500 AS events of a given organism, as indicated by one or two correspondingly colored asterisks, respectively) in human, mouse, or both organisms, respectively

