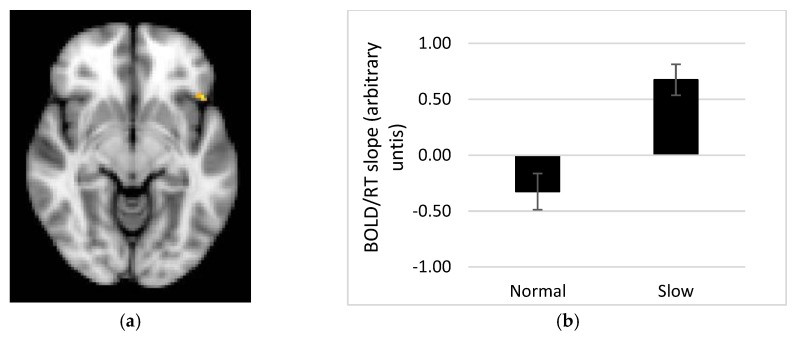
Figure 6.
(a) Cluster of voxels in the OFC showing a stronger relationship between the BOLD response in this region shown and response times for portion size trials in the slow rate group compared to the normal rate group. This region may show a strong association with memory for eating as linked to task performance. (b) Mean % BOLD signal change for the analysis extracted for this region of the OFC for each group (error bars show S.E. mean). The slow group show a steeper BOLD/RT relationship in the region shown in (a).

