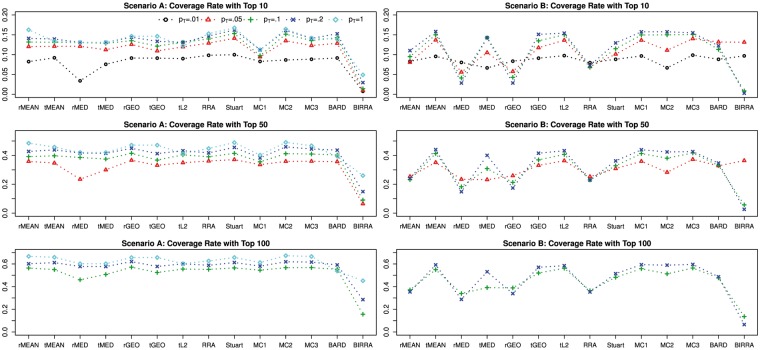
Figure 6.
Coverage rates of different methods using data generated from Model I with varying proportion of top ranked genes pT, while other parameters are held constant. For the cutoff 50, coverage rates are not reported for pT = 0.01. This is because all five base rankers only provide rankings for their own top 10 items, and their union is likely to contain <50 items because items from different base rankers tend to overlap. The same reasoning applies to the cutoff 100 for , and so the coverage rates in these settings are not reported.

