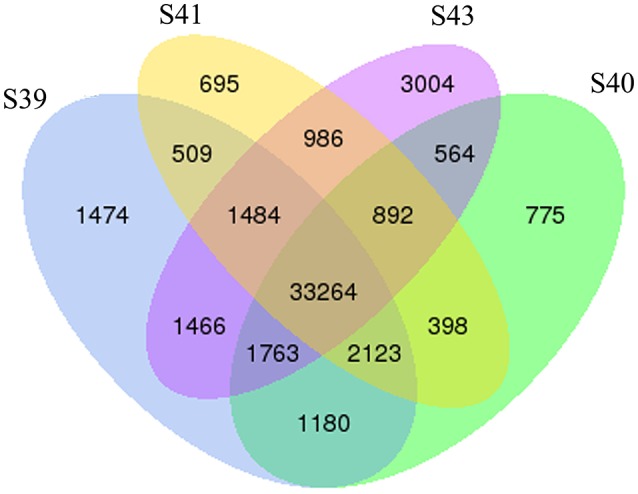
Figure 3.

Venn diagram analyses reveal stage-specific of gene expression. Venn diagrams showing the number of expressed transcripts (FPKM > 0.3) at different stages in the tail during natural metamorphosis. Note that total 50,577 transcripts were expressed in which 33,264 transcripts were expression at all four stages and that each stage had some uniquely expressed transcripts, with S43 having the most. FPKM, fragments per kilobase of exon model per million mapped reads.
