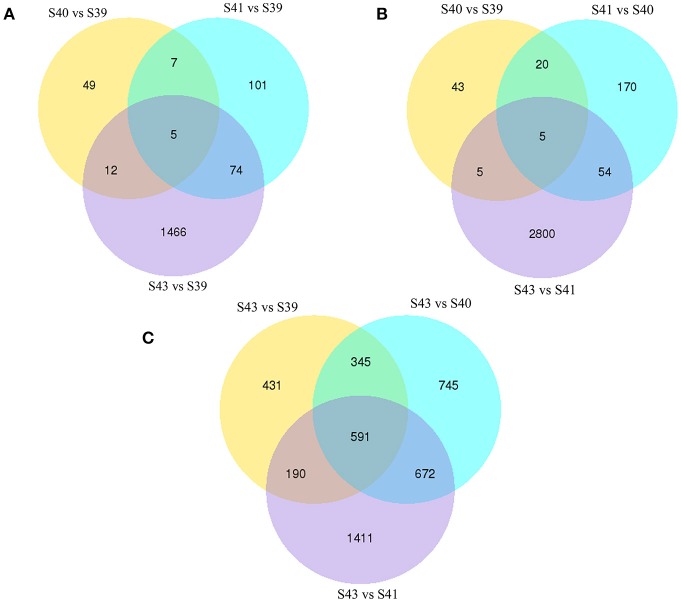
Figure 5.
Venn diagrams of differentially regulated transcripts from pair-wise comparisons show transcript expression profiles at S39-S41 are similar but very different from those at S43. (A) Venn diagrams of DETs between S39 and the other three stages. Note that there were few DETs between S39 and S40 or S41 but much more between stages S39 and S43. (B) Venn diagrams of DETs between two successive stages. Note that there were few DETs between S39 and S40 or between S40 and S41 but much more between S41 and S43, indicating that the gene expression profile changes correlates well with the drastic morphological changes since drastic tail resorption takes place between S41 and S43 (Figure 1). (C) Venn diagrams of DETs between S43 and the other three stages. Note that there were many DETs between S43 and any other stages, including 591 common DETs between S43 and the other three stages.

