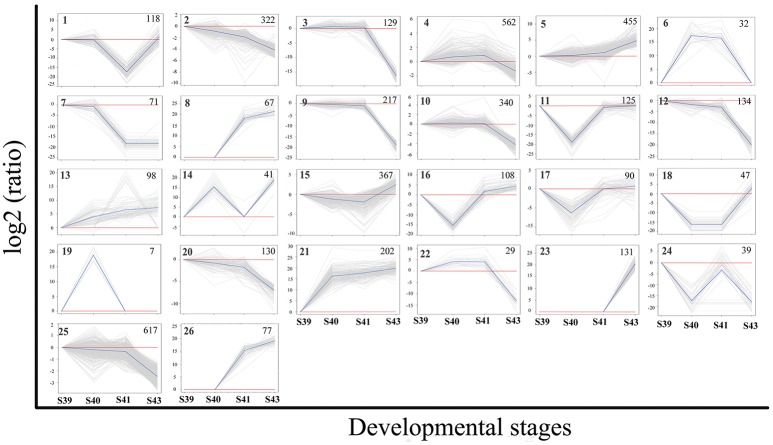
Figure 6.
K-means clustering profile of DETs during tail resorption. A total of 4,555 DETs were grouped into twenty-six clusters based on their developmental regulation patterns. (Note that as there are three possible changes in gene expression between any two stages: up, down and unchanged, there are totally 27 possible clusters among 4 stages. One cluster, i.e., the one with no changes in gene expression among 4 stages, is absent among the DETs.) Each gray line represents one transcript and the average relative expression levels of all transcripts are shown as a blue line. The vertical axis represents the expression level and the horizontal axis shows the four developmental stages. The cluster number is shown as a bold number in the upper left corner and the number in the upper-right corner of each cluster indicates the number of transcripts in the cluster.

