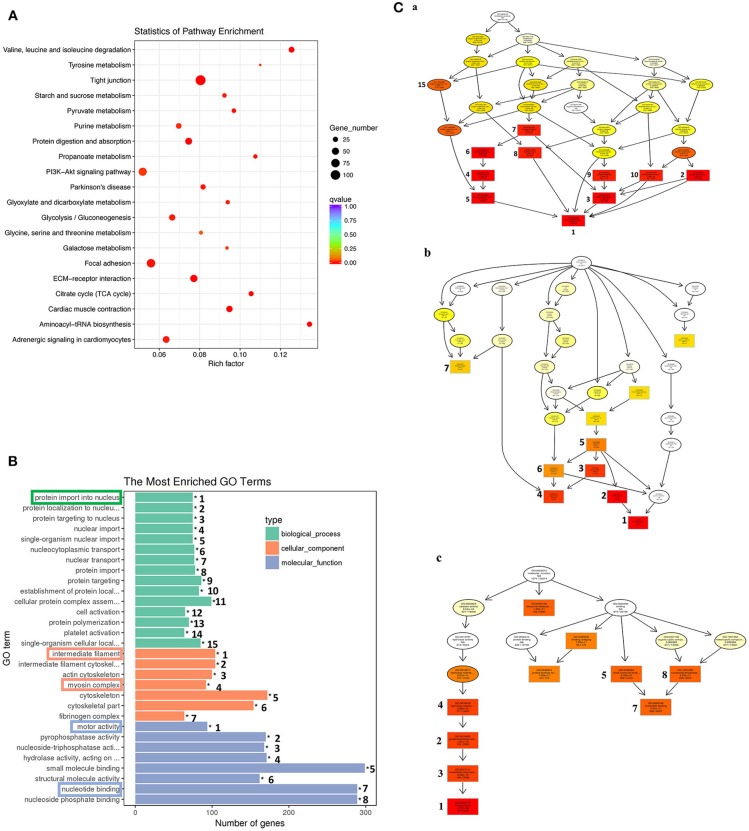
Figure 7.
KEGG and GO analyses reveal important down-regulated pathways and GO terms during tail resorption. The 1,596 genes in the down-regulated subcluster-3, 9, 10, 12, 20, 22, 25, in Figure 6, were combined and subjected to GO and KEGG enrichment analyses. Twenty-one significantly enriched (q < 0.05) KEGG pathways (Table S6) and 499 significantly enriched (q < 0.05) GO terms (Table S7) were obtained. (A) Top 20 significantly enriched pathways based on smallest q-value (from the top to the bottom). Rich factor: the number of genes enriched relative to the known number of genes in the same pathway. Red color indicates the significant enriched pathways and the size of the circle corresponds to the known number of genes in the pathway. (B) Top 30 significantly enriched GO terms. Ranking numbers at right site indicate the significant level of the enriched GO terms; boxed ones on the left represent selected GO terms associated with tail resorption. (C) Directed acyclic graph (DAG) displaying the relationship among different GO terms. Each box and circle indicate a GO term and the descriptions inside of which show GO term id, GO description, q-value and the enriched DETs numbers comparison with background gene numbers of indicated GO term from top to bottom. Color depth represents the enrichment degree (red is the most enriched). The numbers next to the color boxes correspond to the GO ranking numbers in B within the three higher level GO terms as shown here: (a) Biological process (shown in green in B) with GO term “protein import into nucleus” as the most significantly down-regulated; (b). Cellular component (shown in orange in B) with GO terms “myosin complex” and “intermediate filament” as the most significantly down-regulated; and (c). Molecular function (shown in blue in B) with the GO term “motor activity” as the most significantly down-regulated.

