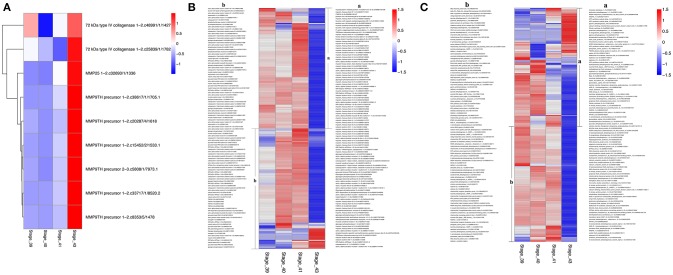
Figure 8.
Heatmaps showing coordinated regulation of genes in selected GO terms during tail resorption. The intensity of color indicates relative expression levels. Red to blue corresponds to high to low levels of expression. (A) A heatmap of all transcripts encoding matrix metalloproteinases (MMPs) within the 4,555 DETs. Note that all MMP transcripts were highly upregulated at stage 43, although they were from only three different MMP genes. (B) A heatmap of all transcripts encoding genes related to muscle function within the 4,555 DETs. Note that nearly all were downregulated at stage 43 when tail resorption takes place. (C) A heatmap of all transcripts encoding genes related to mitochondrial function within the 4,555 DETs. Note that nearly all were downregulated at stage 43 when tail resorption takes place.

