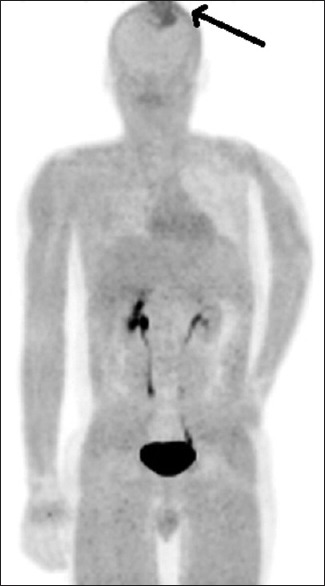
Figure 4.

Maximum intensity projection positron emission tomography image of fluoroethyl tyrosine scan showing a single lesion in the skull marked with an arrow having increased fluoroethyl tyrosine uptake; however, no uptake in the left humerus is noted
