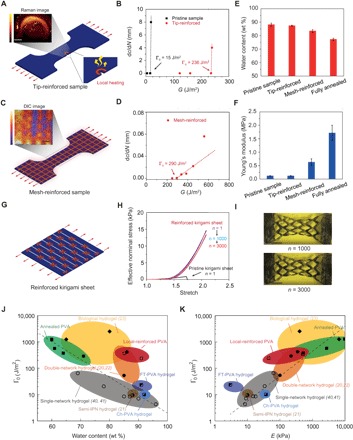
Fig. 5. Patterning highly crystalline regions in PVA hydrogels.

(A) Illustration of introducing a highly crystalline region around crack tip. Inset: Raman spectroscopy with bright color representing low water content and dark color representing high water content (see details in Materials and Methods). (B) Comparison of crack extension per cycle dc/dN versus applied energy release rate G between the pristine sample and the tip-reinforced sample. The fatigue thresholds of the pristine sample and the tip-reinforced sample are 15 and 236 J/m2, respectively. (C) Illustration of introducing mesh-like highly crystalline regions. Inset: Digital image correlation (DIC) method shows large deformation in low-crystallinity regions and small deformation in high-crystallinity regions. (D) Crack extension per cycle dc/dN versus applied energy release rate G of the mesh-reinforced sample. The fatigue threshold of the mesh-reinforced sample is 290 J/m2. (E) Water contents of the pristine sample, the tip-reinforced sample, the mesh-reinforced sample, and the fully annealed sample. (F) Young’s moduli of the pristine sample, the tip-reinforced sample, the mesh-reinforced sample, and the fully annealed sample. (G) Illustration of introducing highly crystalline regions around cut tips in a pristine kirigami sheet. (H) Effective nominal stress versus stretch curves of the reinforced kirigami sheet under cyclic loads. Effective nominal stress versus stretch curve of the pristine kirigami sheet under a single cycle of load. (I) Images of the reinforced kirigami sheet under 1000th cycle and under 3000th cycle. (J) Comparison of fatigue thresholds and water contents among reported synthetic hydrogels (20–22, 40, 41), PVA hydrogels with patterned highly crystalline regions, and biological tissues (23). (K) Comparison of fatigue thresholds and Young’s moduli among reported synthetic hydrogels, PVA hydrogels with patterned highly crystalline regions, and biological tissues. IPN in (J) and (K) represents interpenetrating polymer network. Data in (E) and (F) are means ± SD, n = 3. Scale bars, 800 μm (A), 1 mm (C), and 40 mm (I).
