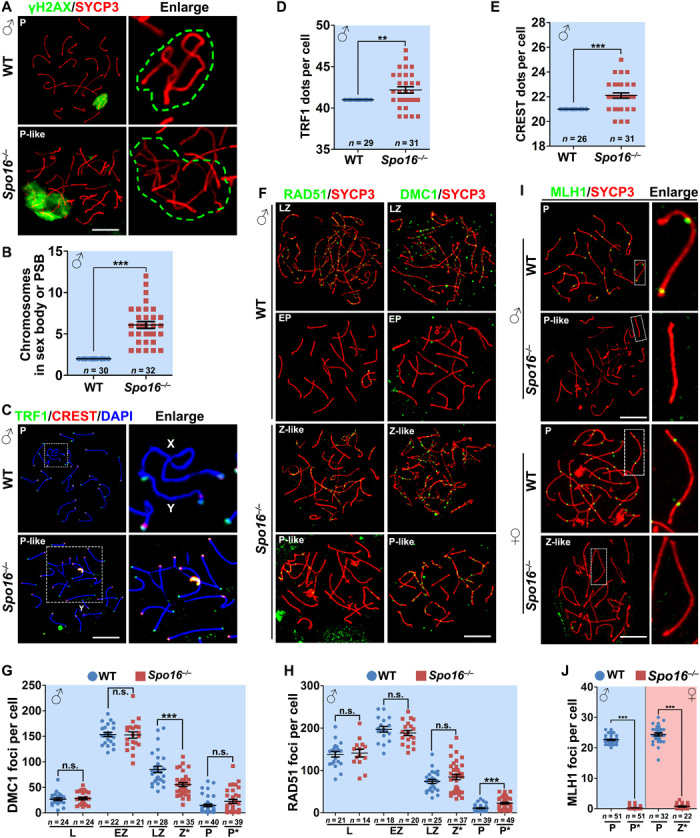
Fig. 4. SPO16 deletion caused defects in homolog pairing and meiotic recombination.

(A) γH2AX (green) staining marked the sex body of WT spermatocytes at pachytene stage and PSB of pachytene-like Spo16−/− spermatocytes. Green dashed lines in the magnified images indicate the area of γH2AX staining. Scale bar, 10 μm. (B) Quantification of chromosomes within the sex body or PSB. Numbers of spermatocytes analyzed (n) are indicated. ***P < 0.001 by two-tailed Student’s t tests. (C) Staining of TRF1 (marker of telomeres; green) and CREST (marker of centromeres; red) showing nonhomologous pairing and asynapsis in Spo16−/− spermatocytes. Scale bar, 10 μm. (D and E) Quantification of TRF1 (D) and CREST (E) dots in WT and Spo16−/− spermatocytes at pachytene and pachytene-like stages, respectively. Numbers of spermatocytes analyzed (n) are indicated. Median focus numbers are marked. Error bars indicate SEM. **P < 0.01 and ***P < 0.001 by two-tailed Student’s t tests. (F to H) Early recombination markers, RAD51 and DMC1, were detected on the nuclear surface spreads of WT and Spo16−/− spermatocytes (F), and the quantifications of RAD51 and DMC1 foci are shown in (G) and (H), respectively. Scale bar, 10 μm. Numbers of spermatocytes analyzed (n) are indicated. ***P < 0.001 by two-tailed Student’s t tests. (I and J) MLH1 (late recombination marker; green) was detected on the nuclear surface spreads of WT and Spo16−/− spermatocytes and PGCs (I) at indicated stages, and the quantification of MLH1 foci is shown in (J). Scale bar, 10 μm. ***P < 0.001 by two-tailed Student’s t tests.
