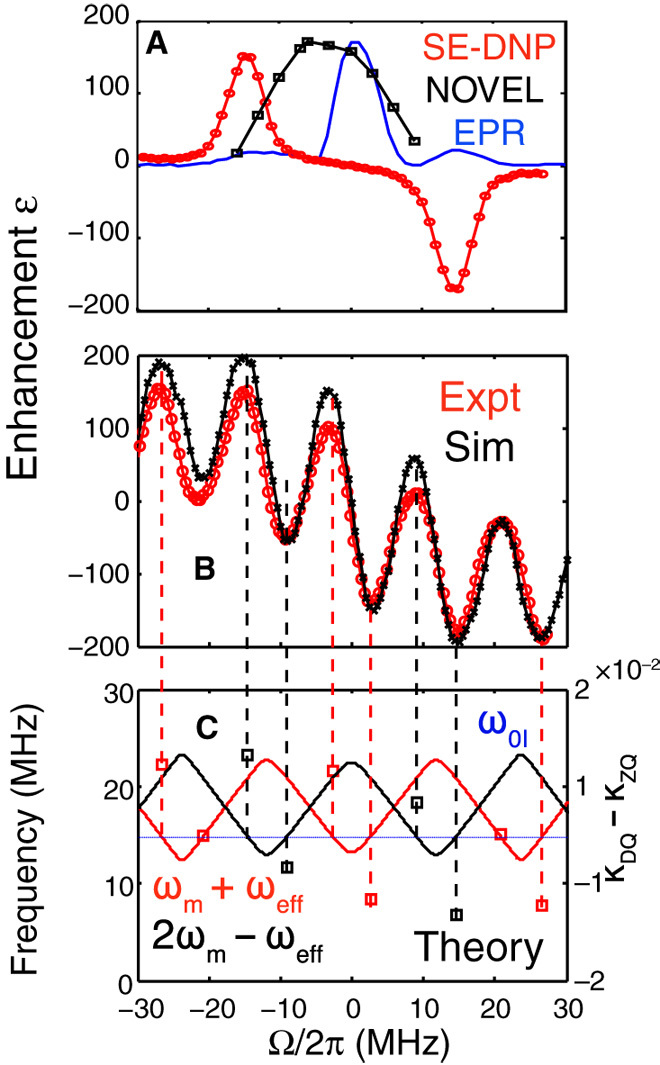
Fig. 2. EPR spectrum, field profiles of various DNP experiments, and calculated characteristic frequencies of TOP-DNP at 0.35 T.

DNP enhancements of (A) pulsed SE and NOVEL, (B) TOP-DNP, and (C) the matching conditions as a function of Ω = ωELDOR − ωe. In (C), the matching conditions are fulfilled at the intersections between ω0I (blue) and ωm + ωeff (red) or 2ωm − ωeff (black), which can then be compared to the experimental (Expt)/simulated (Sim) results (B) via the vertical dashed lines. The values of the scaling factors κDQ − κZQ (square markers of respective colors) are shown on the right y axis.
