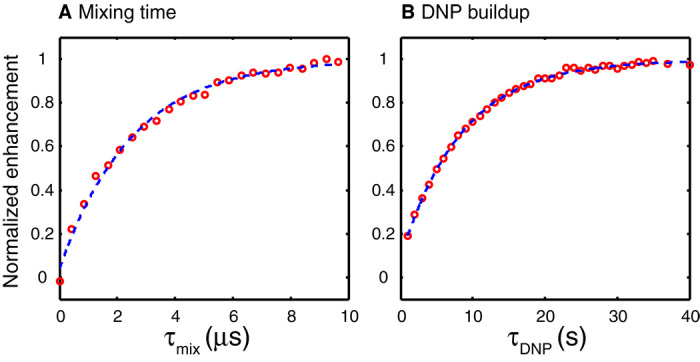
Fig. 3. Experimental buildup curves of TOP-DNP at 0.35 T.

The buildup curves show the enhancement factor as a function of (A) the mixing time τmix by incrementing the loop m, which spans a period of τp + d = 84 ns, while keeping the time τDNP constant at ~8 s and (B) time τDNP by incrementing the loop h (Fig. 1) while keeping the time τmix constant at ~9.7 μs. The fitted single exponential curves (blue) yield time constants of (A) τ1mix ~ 2.5 μs and (B) τ1DNP ~ 8.4 s.
