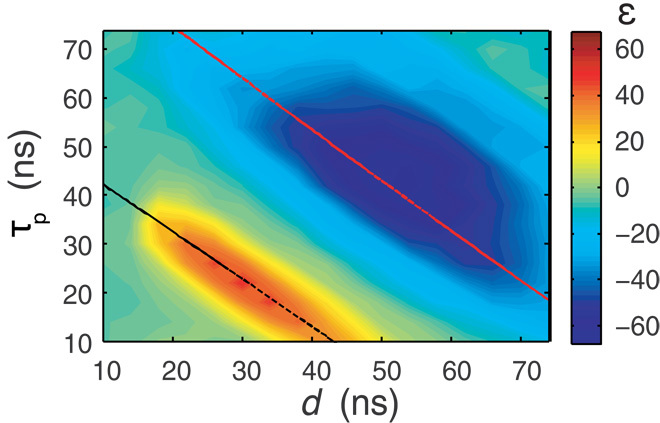
Fig. 4. A contour plot showing 2D optimization of the TOP-DNP enhancement factor against pulse length τp and delay d at 0.35 T.

The experimental data were acquired using a Rabi frequency of ω1S/(2π) = 2 MHz at a fixed offset of Ω/(2π) = 4 MHz, an optimum condition from the field profile (not shown). The matching conditions ωm + ωeff = ω0I (red) and ωm − ωeff = ω0I (black) are indicated with straight lines.
