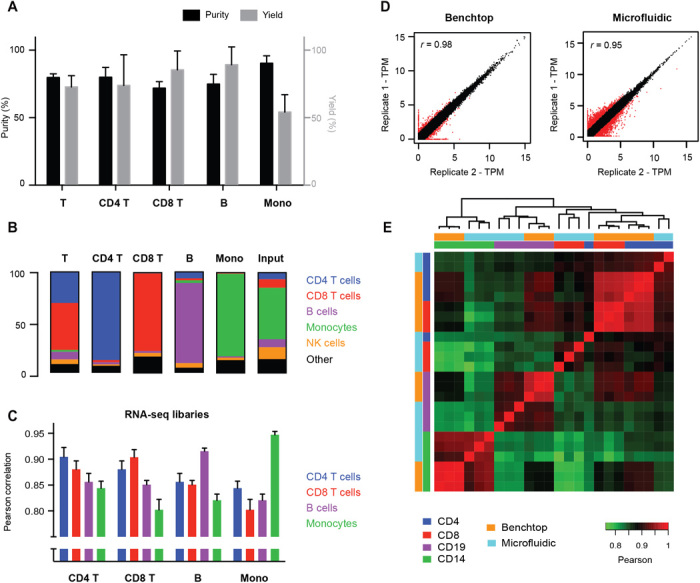
Fig. 2. Chip performance and validation.

(A and B) Representative purity (black bars), yield (gray bars), and composition of immune cell types after microfluidic sorting. Yield is determined relative to fraction of the target subset in the input sample. (C) Pearson correlations between RNA-seq libraries of the four cell subsets processed through the microfluidic chip. (D) Scatterplot showing technical replicability of standard and microfluidic RNA-seq. Red points indicate genes with greater than twofold change between replicates. (E) Correlation matrix between standard and microfluidic RNA-seq libraries for four FACS-sorted cell lysates with single positive markers (CD4, CD8, CD14, and CD19). Error bars indicate SD (n = 3).
