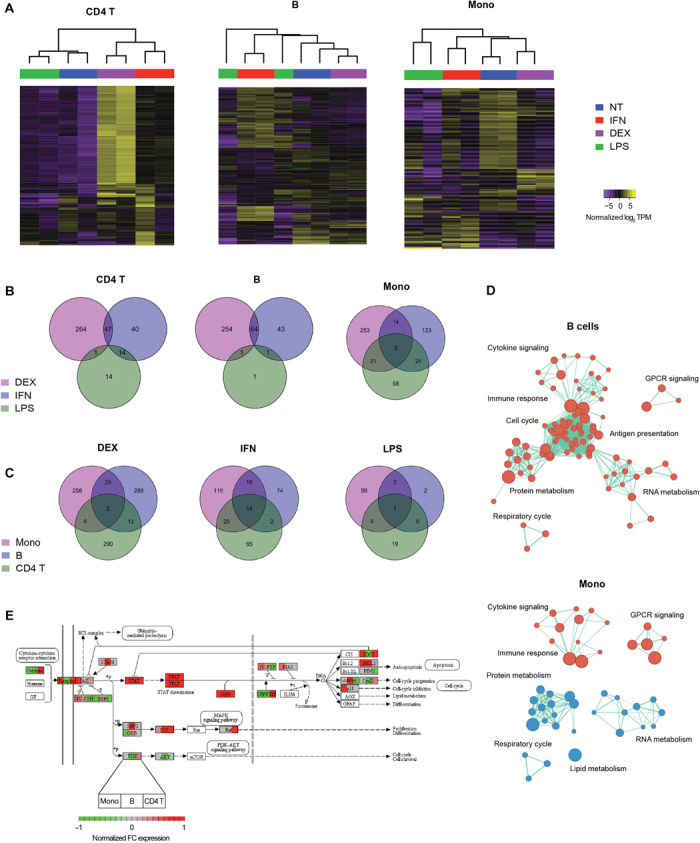
Fig. 3. Genomic characterization of PBMCs treated in vitro.

(A) Unsupervised clustering of untreated (NT) and treated (DEX, IFN, and LPS) PBMC subsets based on differentially expressed genes (false discovery rate < 0.05). Venn diagrams showing numbers of (B) treatment-specific differentially expressed genes for each subset and (C) subset-specific differentially expressed genes for each treatment. (D) Gene set enrichment analysis (Reactome sets, FDR < 0.01) of IFN-treated B cells and monocytes. Red nodes indicate up-regulation, while blue nodes indicate down-regulation. Node sizes are proportional to the number of genes in the gene set, while edge lengths are inversely proportional to the number of overlapping genes between the sets. (E) Normalized fold change (FC) in expression of Jak-STAT pathway genes in IFN-treated samples over untreated controls. Each node shows the fold-change expression of each gene in the three subsets profiled (left block, monocytes; middle block, B cells; right block, CD4 T cells).
