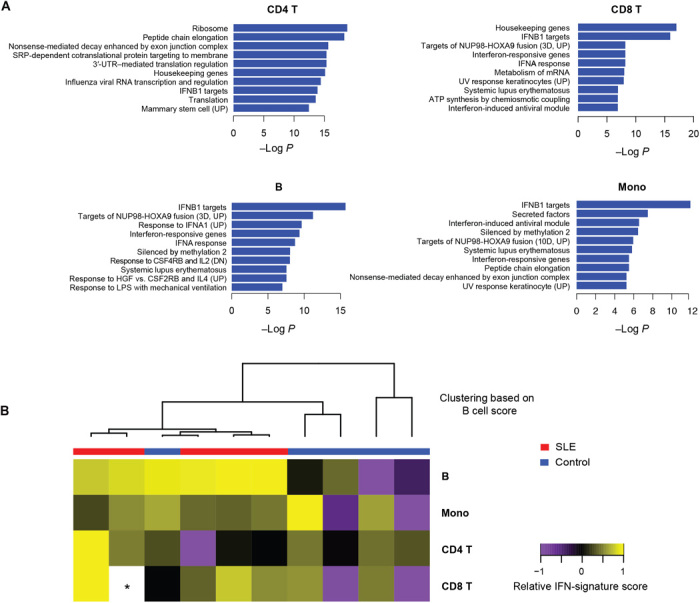
Fig. 4. Transcriptional immune profiling of SLE patients.

(A) Enriched gene sets (MSigDB C2) in SLE samples compared to healthy controls. P values are adjusted for multiple gene set testing (Benjamini-Hochberg). (B) Heat map showing relative IFN-signature scores across different cell types of 10 patients. Scores (transcripts-per-million sum for 37 genes; Supplementary Methods) are mean-centered across each subset. The dendrogram shows clustering of patients based on IFN-signature scores for B cells. The asterisk indicates missing data due to technical dropout.
