
Fig. 1. Simultaneous measurements of pH in the ECM of the growing edge of a S. pistillata microcolony using a LIX microsensor and confocal microscopy with the pH-sensitive dye SNARF-1.
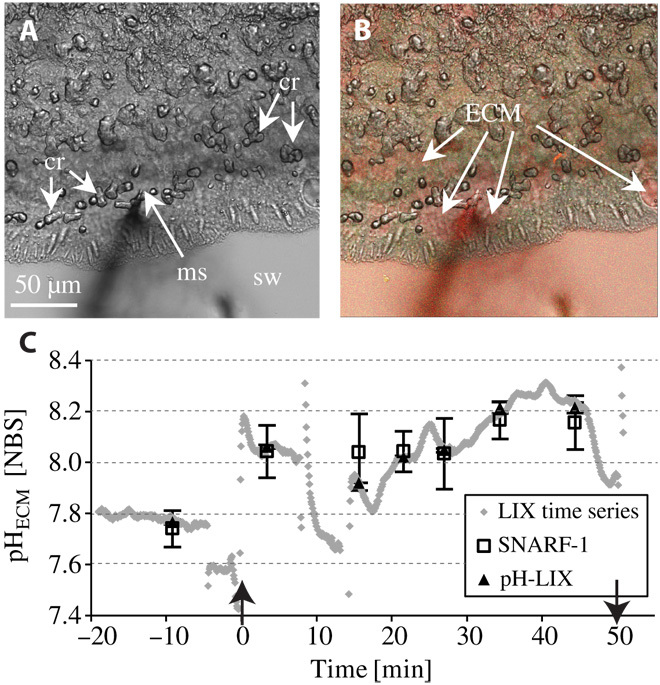
(A) Inverted bright-field image showing the microsensor tip inside of the ECM. ms, microsensor; sw, seawater; cr, crystals. (B) Merged confocal and transmission image of the same area as shown in (A) with the tandem application of SNARF-1 (obtained at 585 ± 10 nm and 640 ± 10 nm) and the LIX microsensor. Green, cells; red, seawater and ECM. (C) ♦, time series of pH-LIX (acquisition time, 5 s); □, average ± SD pHNBS, SNARF-1; ▲, average ± SD pHNBS, LIX obtained during the acquisition of SNARF-1 images; ↑, time of inserting the microsensor into the ECM at time point zero; ↓, time of retracting the microsensor out of the ECM. Data points between the arrows indicate measurements in the ECM, and data points before (negative time) are measurements in the seawater and the coral tissue before entering the ECM. Light conditions, 200 μmol photons cm−2 s−1. No significant difference between microsensor and SNARF-1 pH measurements over the time series (F1,12 = 1.50; P = 0.30).