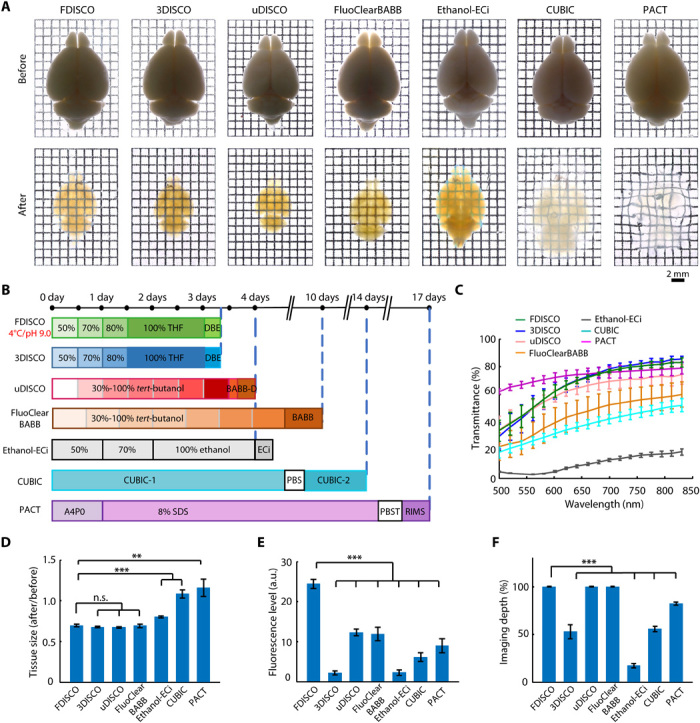
Fig. 3. Comparison of the whole-brain clearing performance of FDISCO and other clearing methods.

(A) Bright-field images of adult whole brains cleared with FDISCO, 3DISCO, uDISCO, FluoClearBABB, Ethanol-ECi, CUBIC, and PACT. (B) Whole-brain clearing protocol timeline. RIMS, refractive index matching solution. (C) Transmittance curves of the brain samples cleared with different clearing methods. (D) Linear expansion and shrinkage of whole brains during optical clearing. (E and F) Quantification of the fluorescence level in the cortex (E) and imaging depth of whole brains (F) cleared with different clearing methods, as assessed by LSFM imaging. All values are means ± SD (n = 5); the statistical significance in (D) to (F) (n.s., not significant, P > 0.05; **P < 0.01; and ***P < 0.001) was assessed by one-way ANOVA followed by Bonferroni or Dunnett’s T3 post hoc test. a.u., arbitrary units.
