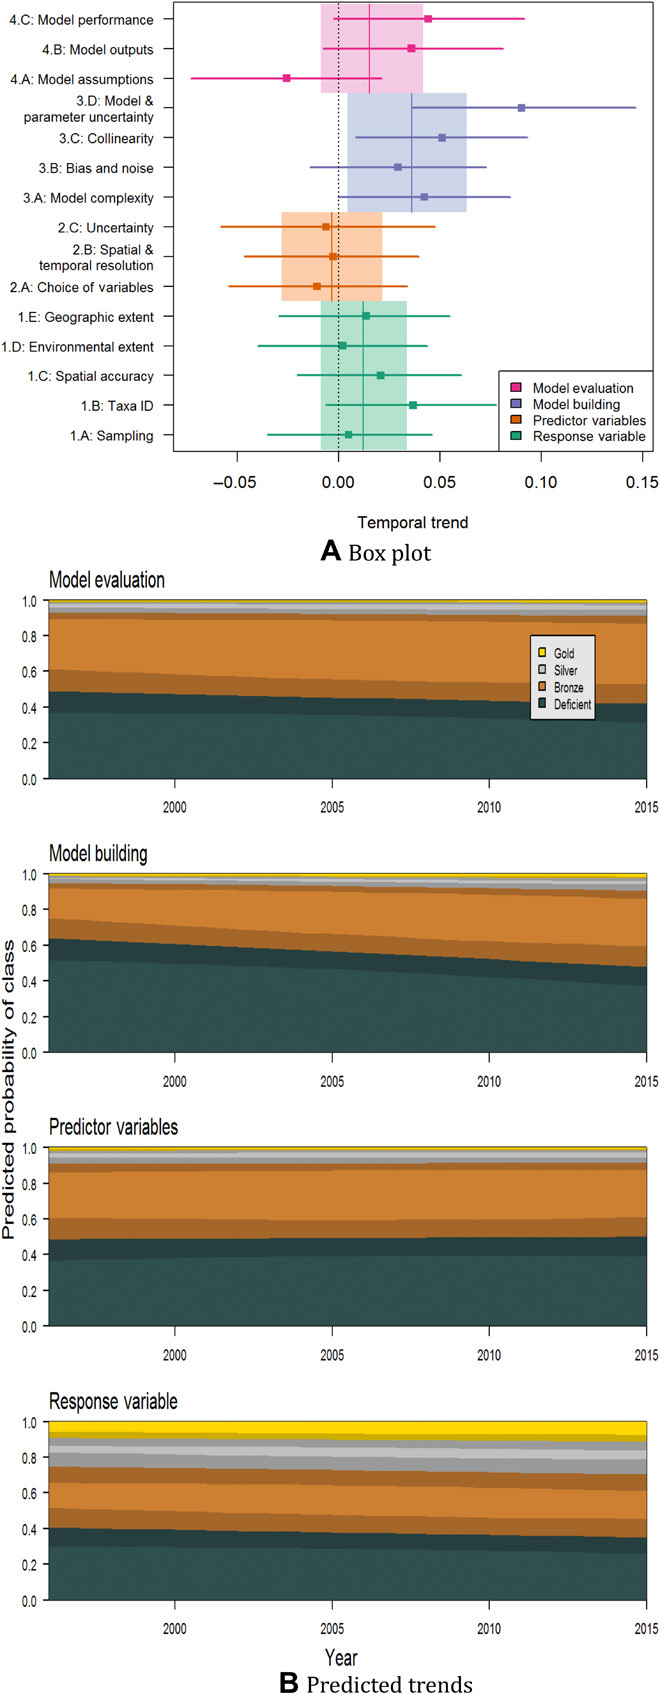
Fig. 4. Changes in best-practice standards of species distribution modeling studies over time.

The diagrams show the results of ordinal regression using “Year” as a continuous variable and the four key aspects of modeling as effects (including an interaction). The analysis was implemented for a sample of 400 modeling studies used for various biodiversity assessments between 1995 and 2015. (A) Values near zero on the x axis represent no change in standards over time, positive values indicate improvement, and bars are 95% credible intervals. (B) Shading represents the 95% credible intervals. Note clear increase in the number of acceptable studies regarding model building as well as lesser increases in the quality of studies with regard to model evaluation and response data. Details on the selection and scoring of articles are provided in text S3 and table S3.1. Figure S1.5 shows the raw scores used.
