
Fig. 5. Colorimetric assay characterization.
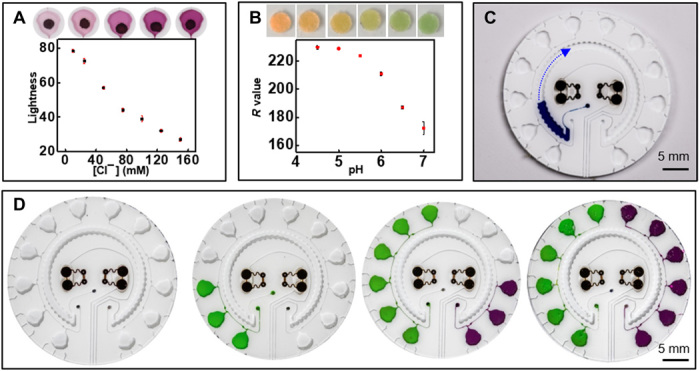
Calibration and corresponding color evolution for physiologically relevant levels of (A) chloride (n = 3) and (B) pH (n = 3). (C) Filling of sweat rate sensor. The arrow indications the direction of filling. (D) Image illustrating the chrono-sampling feature of the microfluidic system. Photo credit: Jungil Choi and Jonathan Reeder, Northwestern University.