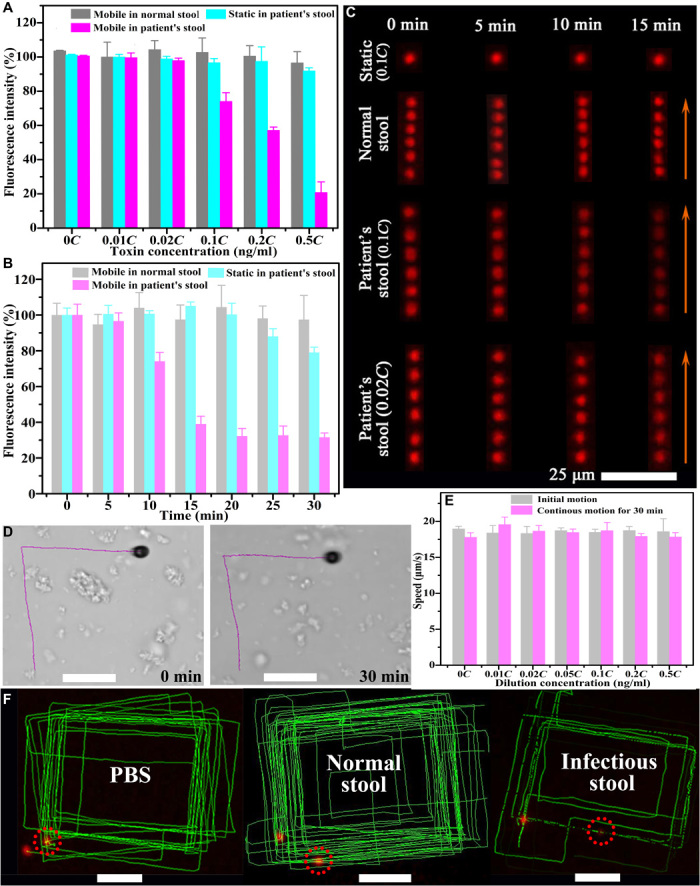
Fig. 5. Fluorescence detection in stool supernatant using the FMSMs.

The changing trend of the fluorescence intensity of static and mobile FMSMs (A) navigated for 10 min in different stool samples and (B) traveling for different times in 0.1C (C = 8.66 ng/ml) stool samples. (C) Fluorescence time-lapse images of static and mobile FMSMs with a time interval of 1 s at different times in different clinical stool supernatants (taken from movie S5). (D) Tracking for 8 s showing the propulsion of FMSMs in the infectious stool supernatant at the beginning and after 30 min. (E) Speed comparison of the FMSMs navigated for 0 and 30 min in the clinical infectious stool supernatant. (F) Tracking fluorescence trajectories of the FMSMs locomoting for approximately 18 min in different samples. Scale bars, 30 μm.
