
Fig. 1. Schematic and principles of FT-CARS flow cytometry.
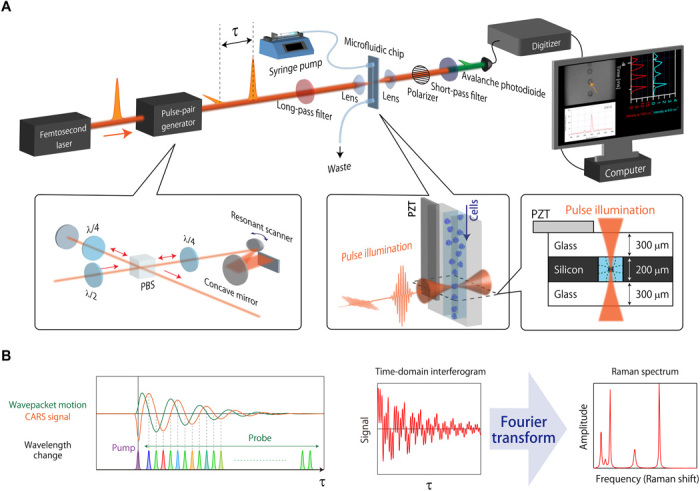
(A) Schematic of the FT-CARS flow cytometer. (B) Principles of FT-CARS spectroscopy. A coherent molecular vibration in the target cell excited by the pump pulse induces a frequency shift to the probe pulse. Fourier transforming the measured time-domain interferogram gives the Raman spectrum of the cell. PBS, polarizing beamsplitter.