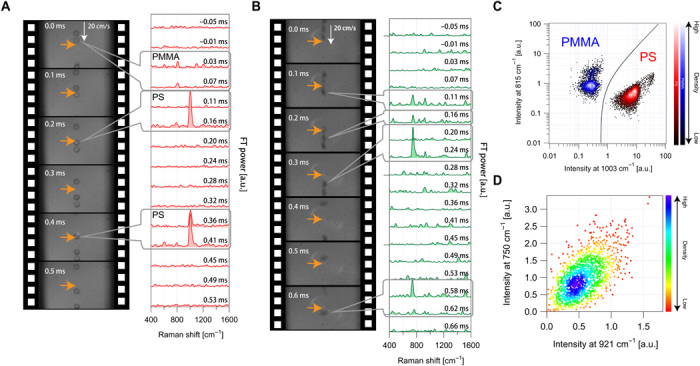
Fig. 2. Demonstration of FT-CARS flow cytometry.

(A) Raman spectra and high-speed camera images of fast-flowing polymer beads of multiple species (PS and PMMA), demonstrating a throughput of 2700 events/s. See movie S1 for details. (B) Raman spectra and high-speed camera images of fast-flowing E. gracilis cells, demonstrating a high throughput of 1555 events/s. See movie S2 for details. (C) Scatterplot of the polymer beads in 1003 and 815 cm−1 intensities of their Raman spectra (n = 2514 PMMA beads and 4873 PS beads) with a high classification accuracy of >99.9%. (D) Scatterplot of the E. gracilis cells in 921 and 750 cm−1 intensities of their Raman spectra, enabling the quantification of intracellular chlorophyll content. a.u., arbitrary units.
