
Fig. 3. High-throughput label-free single-cell analysis of the astaxanthin productivity of H. lacustris.
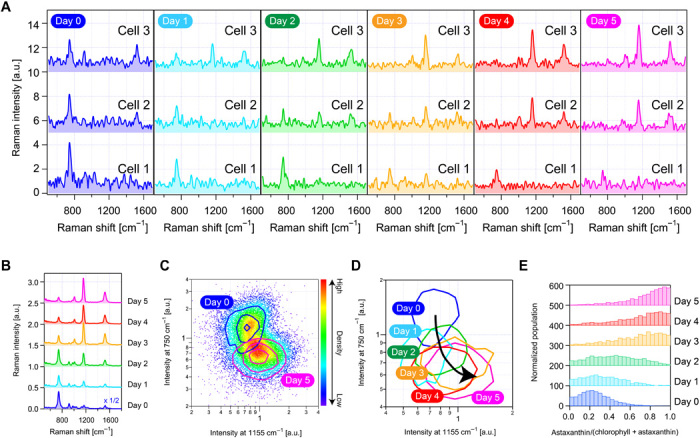
(A) Raman spectra of three single H. lacustris cells under nitrogen deficiency on day 0 through day 5. (B) Averaged Raman spectra of H. lacustris cells (n = 8000 for days 0, 1, 4, and 5; n = 6000 for days 2 and 3) under nitrogen deficiency, showing their gradual production of astaxanthin over time. (C) Scatterplot of H. lacustris cells (n = 8000 for each condition) under nitrogen-sufficient (day 0) and nitrogen-deficient (day 5) conditions in 1155- and 750-cm−1 Raman intensities, showing their separation by the different cultural conditions and heterogeneity in the productivity of astaxanthin. (D) Contour plot of H. lacustris cells under nitrogen deficiency for 0 to 5 days, showing their 5-day evolution. (E) Evolution of H. lacustris cells (n = 20,020) in the production of astaxanthin.