
Fig. 4. High-throughput label-free single-cell analysis of the photosynthetic dynamics of H. lacustris.
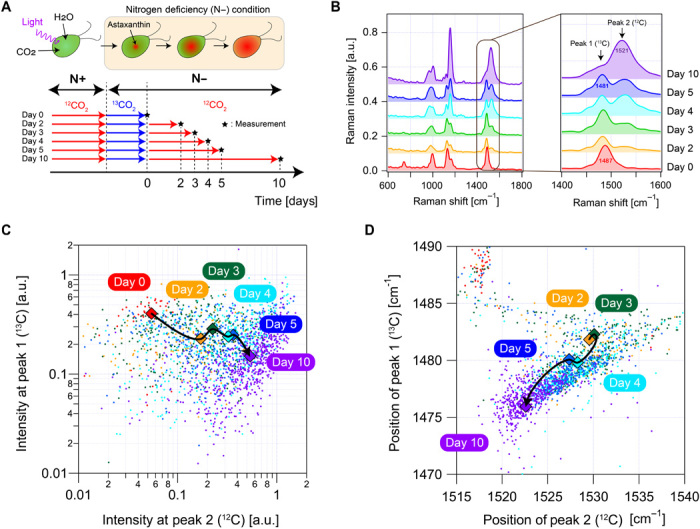
(A) Procedure of preparing H. lacustris cells with different degrees of isotope substitution of carbon dioxide. (B) Averaged Raman spectra of H. lacustris cells (n = 3000 for each condition) 0 to 10 days after the isotope substitution. (C) Scatterplot of H. lacustris cells (n = 2592) in Raman intensities of the two peaks, showing their 10-day evolution. (D) Scatterplot of H. lacustris cells (n = 2592) in Raman shifts (positions) of the two peaks, showing their 10-day evolution.