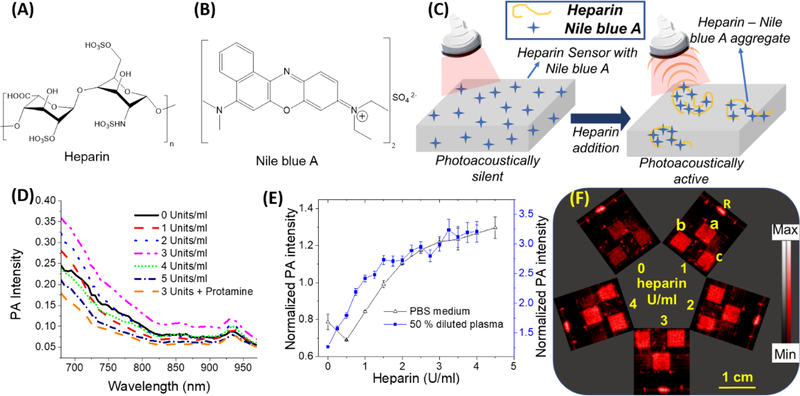
Fig. 1. Spectral and photoacoustic study of Nile blue A and cellulose based sensor in PBS and 50% diluted human plasma.

(A) Chemical structure of heparin. (B) Chemical structure of Nile blue A. (C) A schematic illustration of sensing mechanism of the sensors. Cationic dyes like Nile blue A form aggregates with heparin. The heparin-Nile blue A aggregates are much more photoacoustically active compared to non-aggregated Nile blue A molecules leading to an increased photoacoustic signal. (D) Photoacoustic spectrum of Nile blue A in aqueous solutions with different amounts of heparin. The maximum photoacoustic signal for Nile blue A was observed at 680 nm and hence 680 nm excitation was used throughout this study. (E) A plot of the ratio of average photoacoustic intensity of three sensors treated with increasing heparin concentrations normalized to the reference line (that does not change with heparin concentration) as a function of heparin concentration in PBS and 50% diluted plasma. (F) Photoacoustic image of three sensors (0.5 × 0.5 cm area) simultaneously treated with different heparin doses in 50% diluted pooled human plasma. The sensors labeled as a, b, and c are replicates with identical composition, and R is the reference line whose intensity remained constant regardless of heparin. The relative standard deviation for the diluted plasma assay is < 6.1%; the detection limit was 0.02 U/ml heparin in 50% diluted pooled human plasma. Error bars indicate the standard error of the three measurements.
