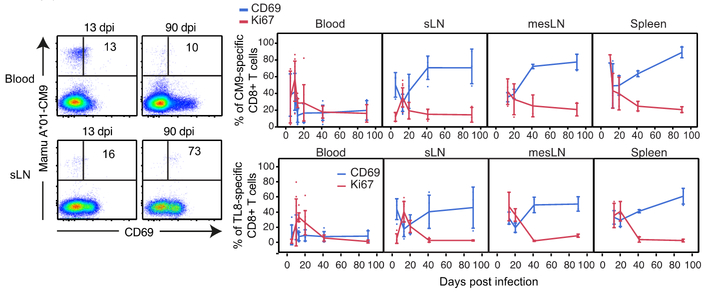
Fig. 6. SIV-specific CD8+ T cells develop TRM characteristics over time.
Representative flow cytometry plots showing CD69 expression on blood (top) and superficial LN (sLN; bottom) SIV-specific (Mamu A*01-Gag-CM9) CD8+ T cells at 13 and 90 days post-infection (dpi; left). Longitudinal dynamics of CD69 (blue) and Ki-67 (red) expression on/in blood, sLN, MesLN, and spleen SIV-CM9 or TL9-specific CD8+ T cells (13 dpi: n = 12; 90 dpi: n = 3). The longitudinal SIV-CM9 or TL9-specific CD8+ T cell response is plotted at each time point as mean ± SD. *P < 0.05, **P < 0.01; ***P < 0.001. Conventional flow cytometry was used for all stains in this figure.

