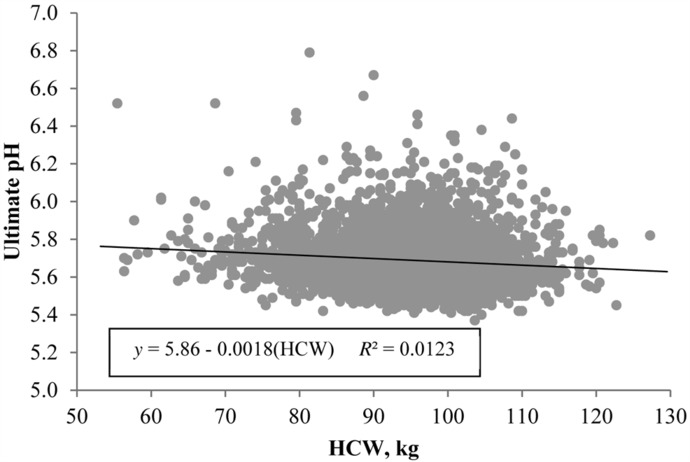
Figure 2.

Effect of carcass weight on boneless loin ultimate pH. Data are depicted as the linear regression of the trait using carcass weight as the independent variable. Prediction equations and coefficients of determination included on figures where the slope of linear regression lines were different from 0 (P < 0.05).
