
Figure 2.
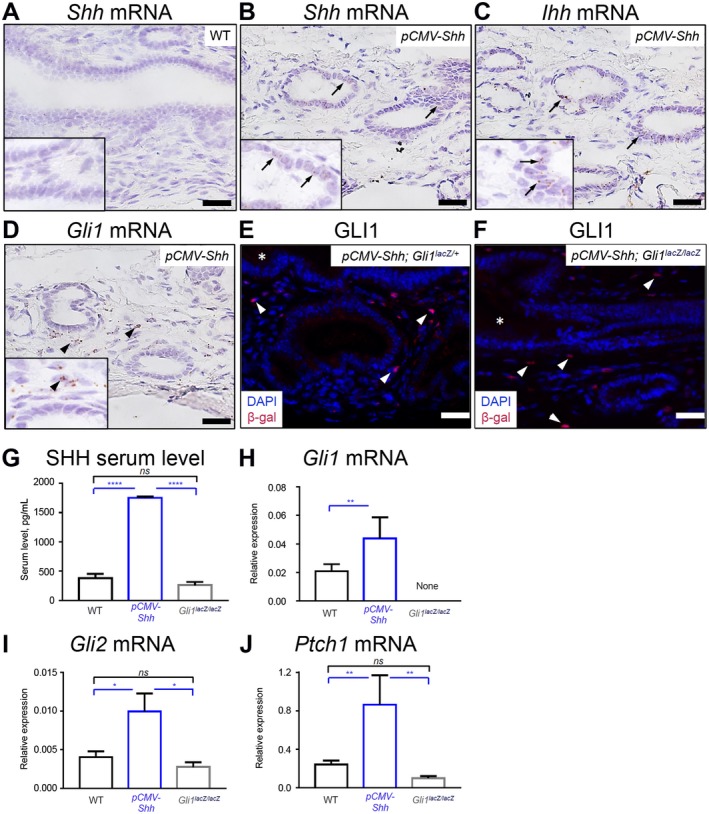
pCMV‐Shh and Gli1lacZ/lacZ mice model chronic HH overexpression and inhibition in EHBDs. EHBDs from WT, pCMV‐Shh, and Gli1lacZ/lacZ mice were studied for expression of HH ligands and signaling targets. (A‐D) We analyzed EHBDs from WT and pCMV‐Shh mice with in situ hybridization (RNAscope) for (A,B) expression of Shh mRNA (arrows) and EHBDs from pCMV‐Shh mice and for (C) expression of Ihh mRNA and (D) Gli1 mRNA (representative images of two samples). (E,F) Gli1 expression was also studied by immunofluorescence for β‐galactosidase (red; arrows) in pCMV‐Shh; Gli1lacZ/+ and pCMV‐Shh; Gli1lacZ/lacZ mice. Cell nuclei were marked with DAPI (blue; representative images of one and two samples, respectively; arrows, epithelial cells; arrowheads, stromal cells; asterisks, lumen; scale bars, 20 µm). (G) Serum level of the SHH ligand was measured by enzyme‐linked immunosorbent assay in WT, pCMV‐Shh, and Gli1lacZ/lacZ mice. (H‐J) Total RNA was isolated from EHBDs of the WT, pCMV‐Shh, and Gli1lacZ/lacZ mice and analyzed for mRNA expression by qPCR of (H) Gli1, (I) Gli2, and (J) Ptch1 referenced to Hprt. Results are expressed as mean ± SEM (n = 8‐19 animals per group; one‐way ANOVA); *P < 0.05, **P < 0.01, ****P < 0.0001. Abbreviation: ns, not significant.